Browse Stacks: Trading: Options
06268de8644a2b9b1ab9887922644be5.png (1602×813)
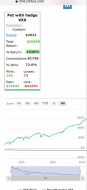
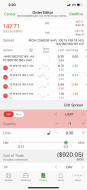
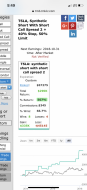
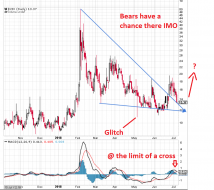
The melt-up has caused downside protection to collapse in relative volatility terms. Bullish or bearish, hedging d...

total call volume.gif (924×515)
Call volume is batshit insane - - massive new highs
3
slopechart_$SPPC.jpg
P/C with 10 SMA

99de857d29b7a19b31f89d52561fc61a.png (1558×741)
NO ONE is buying puts anymore.
1
cost to hedge.png (668×459)
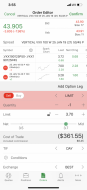
Goldman's Brian Garrett writes, looking at the bank's S&P500 option pricing data going back to 1996, "in the world...
67db61a9700575b70a6243ac19ed9dbe.png (1503×718)
put call ratio is at the lowest levels in a long time
VolatilityGrid_AAPL,CART,GOOGL,HD,INTC,META,MSFT,NVDA,T,V.jpg

2023-07-20_08-52-18.jpg (1065×518)
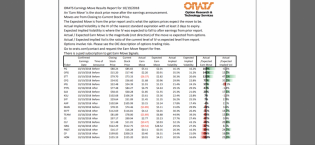
Shown below are is the performance of the SPX after each 3rd Friday expiration.
1
bfm37CC_0.jpg (941×543)
Put/Call ratio across all stocks dropped to its lowest since March 2022...
bfm3343.jpg (941×563)
And the put/call ratio across the entire market dropped to a critical level (led by call volume soaring) which in...
l6pl02qyhc1a1.jpg (468×379)
2022-10-24_08-43-52.jpg (1280×768)
2
2022-09-12_13-59-11.jpg (974×530)
1
qhn1q5jsisb91.png (960×944)
Wow! From reddit.......
2
4qbxhfwy3g091.jpg (640×901)
2022-03-18_05-42-48_0.jpg (1035×697)
Don't forget today was a triple witch with $3.5 trillion in options expiring and dramatic amounts of gamma unclenchin...
2022-01-31_07-55-01.jpg (993×561)
slopechart_FSR.jpg
One of the weaker EV companies that is near tapping against right shoulder. Big gap to fill, early in the downtre...
slopechart_FVRR.jpg
I'm banking on a similar situation with FVRR. Gaps are in pink -- one on each of the last two earnings. Next ear...
slopechart_FVRR.jpg
FVRR is another Vid winner wildly overvalued. Has been on a steady decline since peaking in March. With the number...
c20ep5cncpv71.jpg (1170×2020)
Ah, yes, the power of leverage.
guldxbphxnv71.jpg (1163×582)
Someone had a lot of cash to lose.
1
bfm230F_0.jpg (1009×581)
2021-01-28_11-27-19.jpg (1280×1011)
1
p1o4c2suqid61.jpg (540×961)
I hereby present unto you unchecked insanity deluxe.
call bubble.png (1024×506)
slopechart_SNOW.jpg
SNOW options listed
record fragility.png (531×364)
file

1
tv.jpg
Scott Redler @RedDogT3

option volume record_1.jpg (772×553)
Put-Call-Ratio.png (541×333)
s3.amazonaws.com/cdn2.soci..._3lHcGq_l.png
Decent risk reward which improves with rising volatilityp

3
s3.amazonaws.com/cdn2.soci..._lS4XqU_l.png
Low risk high reward with rumors of DB possible bankruptcy
1
s3.amazonaws.com/cdn2.soci..._ZEKmui_l.png
Another way to play BIDU earnings. Direction less important than magnitude
5
s3.amazonaws.com/cdn2.soci..._XreL4I_l.png
BIDU bearish play with 50/50 shot and large upside with smaller downside
3
s3.amazonaws.com/cdn2.soci..._juguUE_l.png
Vic strictly straddle
3
NUGT.png
http://www.321gold.com/editorials/sfs/hubbartt092019.html
bfm2FB6.jpg (1280×640)
1
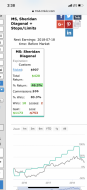
s3.amazonaws.com/cdn2.soci..._QodecV_l.png
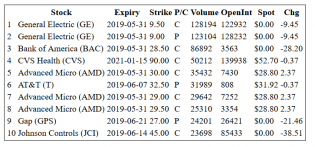
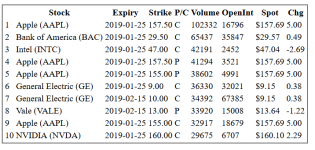
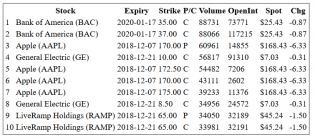
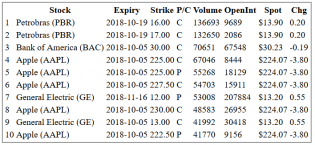
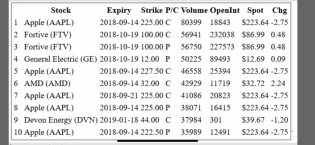
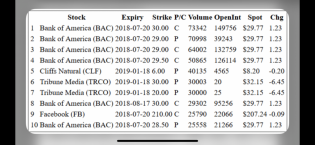
Unusual options activity as of May 28th 2019
1
s3.amazonaws.com/cdn2.soci..._qbabQD_l.png
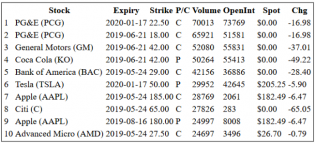
Unusual options activity report for 5/20/19
2
s3.amazonaws.com/cdn2.soci..._gIl0l5_l.png
Short hedge + ratio spread, near minimal loss with increase in value with volatility
3
s3.amazonaws.com/cdn2.soci..._lKcFWW_l.png
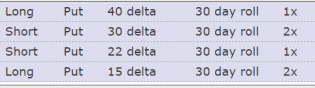
20 d INV strategy for options
3
item5 — imgbb.com
2019-03-23-1341 — imgbb.com
1
2019-03-22-0918 — imgbb.com

1 feb18.PNG

s3.amazonaws.com/cdn2.soci..._JB67gf_l.png
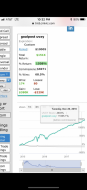
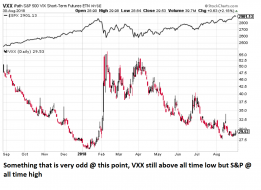
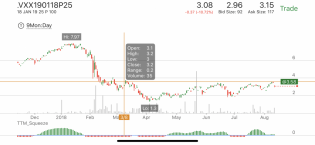
Goalpost VXX
2
s3.amazonaws.com/cdn2.soci..._nhTWuB_l.png
VXX strategy
6
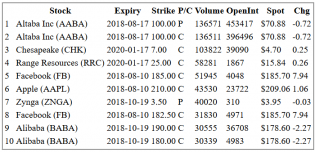
s3.amazonaws.com/cdn2.soci..._YrRo6Y_l.png
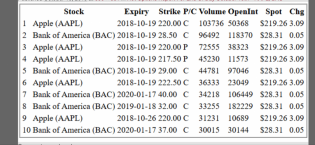
Unusual options activity
s3.amazonaws.com/cdn2.soci..._CTb5Hf_l.png
Reverse iron condor BABA
1
s3.amazonaws.com/cdn2.soci..._evA3F4_l.png
2
s3.amazonaws.com/cdn2.soci..._OKmUuM_l.png
2
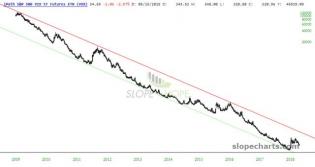
sc (1565×681)
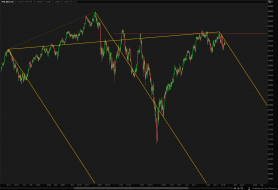
SPX - monthly.

s3.amazonaws.com/cdn2.soci..._leez02_l.png
Unusual options activity
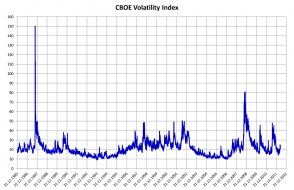
Résultat de recherche d'images pour "VIX"
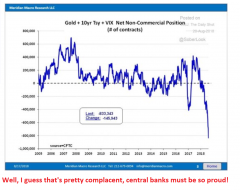
When you include the 87 crash you can see how dumb a VIX below 10 was in 2017 2018!
1
2 dec6.PNG

slopechart_ORCL.jpg
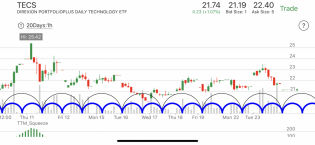
s3.amazonaws.com/cdn2.soci..._Qn3uLm_l.png
Cycle points tk higher prices in the 3x tech bear etf
s3.amazonaws.com/cdn2.soci..._1lm0gu_l.png
Unusual options activity
s3.amazonaws.com/cdn2.soci..._Mw3KFO_l.png
ORATS earnings report
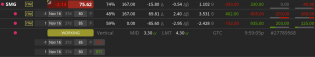
SMG_vol.PNG
The effect of vol on illiquid stocks. I can't tell if volatility affected the lack of movement in the price of thi...

5
s3.amazonaws.com/cdn2.soci..._5aX3p7_l.png
Unusual options activity
s3.amazonaws.com/cdn2.soci..._zY10f2_l.png
3
s3.amazonaws.com/cdn2.soci..._fmgzeD_l.png
Unusual options activity
9 aug31.png

8 aug31.png

s3.amazonaws.com/cdn2.soci..._5MxQbg_l.png
VIX
4
silverweekly7.jpg
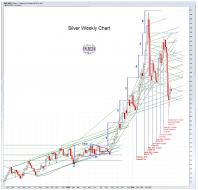
Silver weekly chart with option expiries.
1 aug22.png
s3.amazonaws.com/cdn2.soci..._LTEjxN_l.png
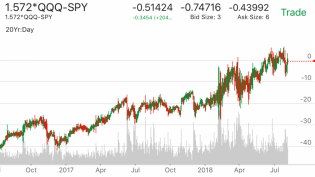
SPY IWM core trade, immensely profitable
4
s3.amazonaws.com/cdn2.soci..._8Wop9J_l.png
Critical resistance of $3.58 for the $25 jan 2019 put
1
s3.amazonaws.com/cdn2.soci..._gj3803_l.png
Unusual options activity
4
s3.amazonaws.com/cdn2.soci..._J7y9sE_l.png
Qqq extreme greed. Will be adding to QQQ put position
s3.amazonaws.com/cdn2.soci..._VkZ77r_l.png
Tsla in bear squeeze formation, super bear risk reversal
1
s3.amazonaws.com/cdn2.soci..._Rsdwld_l.png
NCDA, 50 delta call, 30 d to expiry, exit 40 % win or loss
2
s3.amazonaws.com/cdn2.soci..._uOzysC_l.png
Unusual options activity week of jul 16
1
s3.amazonaws.com/cdn2.soci..._AeAtbs_l.png
1
s3.amazonaws.com/cdn2.soci..._CRNHe9_l.png
3
s3.amazonaws.com/cdn2.soci..._JQ2fo1_l.png
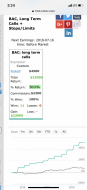
Long term calls (180 d to expiry, 20 delta), enter 2 days after earnings and exit 29 d post eqrnings. Exit at 20%...
4
s3.amazonaws.com/cdn2.soci..._fIMiVd_l.png
Another strategy. $378 risked. Easily can make 20-30% on this strategy over a week.
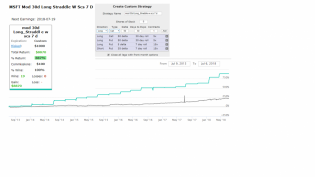
s3.amazonaws.com/cdn2.soci..._9JAwU9_l.png
MSFT pre-earnings Module #1
1
2 july7.PNG

9 june15.PNG
1

7 june15.PNG
6 june15.PNG
2 june12.PNG
8 may18,.PNG
s3.amazonaws.com/cdn2.soci..._LRHrAA_m.jpg
Original automatic trendline for VXX. This is a _big fucking deal_
3
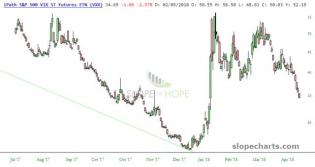
s3.amazonaws.com/cdn2.soci..._YGlFzv_m.jpg
As God Intended. Automatic trendline for VXX going back 10 + years. With this information, a long straddle in VX...
4

5 may3.PNG

2 may3.PNG
1 may1.PNG

6 apr25.PNG

1 apr25.PNG
11 apr24.PNG
4
![2018-04-23_9-26-50[1].jpg](https://s3.amazonaws.com/cdn2.socialtrade.com/st/shards/22331_OfeTqmGy_h)
2018-04-23_9-26-50[1].jpg

image.png
Ride the Vix settlement manipulation wave
(12,000 far OTM puts bought on SPX 1 mo ahead between 8:30 and 9:30 ED...
4

F90C1C2C-FB6B-4B47-9B7A-363608064839.png
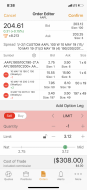
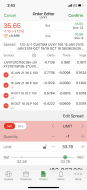
Bullish BMY
Good risk/reward.
5