User: vidivici: $SPX
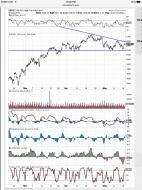
image.jpg
$SPX - no real reason to get too aggressive on the bullish side unless/until $SPX breaks upward out of this descendin...

1
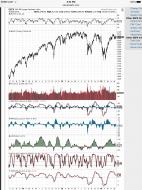
image.jpg
$SPX - ignore the short term noise and look at the big picture. There really is not much bullish about this chart...
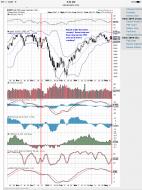
image.jpg
$SPX - repeat of last December coming up? A lot of similarities on the chart.
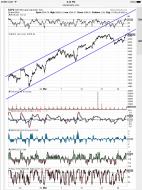
image.jpg
$SPX - Yellen jawbones $SPX up to the underside of the channel it has fallen out of. All talk, no action. Wonder...
1
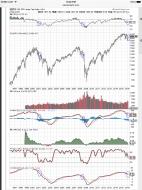
image.jpg
$SPX - don't lose sight of the big picture. Where we are now is analogous to the start of the second half of 2008.
6
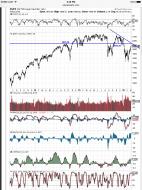
image.jpg
$SPX - watch the 2019 area as a possible ceiling for the current rally.
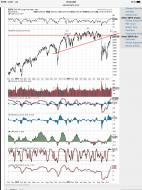
image.jpg
$SPX - right at two important levels of resistance and possibly beginning to map out the right shoulder of a massi...
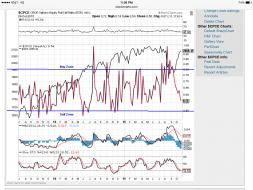
image.jpg
$SPX approaching sell zone per equity options put/call ratio. $SPX could rise a bit more here, but risk is clearl...
2
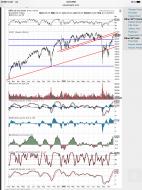
image.jpg
SPY - approaching underside of broken long term support.
1
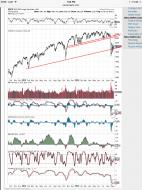
image.jpg
$SPX - looking for a very big upward move this week on the $SPX. Very positive developments in RSI, MACD, Slow St...
3
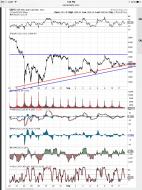
image.jpg
$SPX - for all of the short term bears out there, this chart is showing a series of higher lows since late August...
2
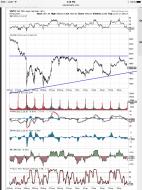
image.jpg
$SPX - watch the 1920 area on the $SPX tomorrow morning. A bounce in that area sets up a right angle, upward slop...
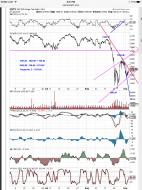
image.jpg
$SPX - butting up against the short term descending red resistance line. If it can't break the line tomorrow, new...
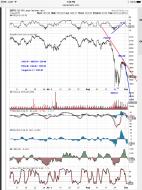
image.jpg
$SPX - I probably just jinxed it, but here is an update on my $SPX chart from Sunday. So far, so good, but I am s...
2
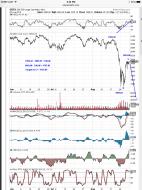
image.jpg
$SPX - not a prediction, more like a hope. I do think we will see a violent capitulation early this week, followe...
1
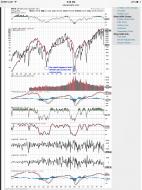
image.jpg
$SPX - per the $SPX/VIX ratio, we are likely due for a short term bounce, but we are a long, long way from "the bo...
1
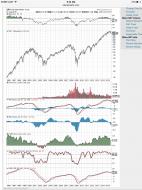
image.jpg
$SPY - anybody going long the market here (other than a bounce play) should take a good look at this chart and ask...
2
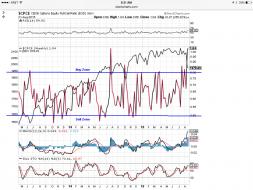
image.jpg
$SPX - equity options put/call ratio suggests that market is due for a bounce here. Playing the long side is risk...
1