User: vidivici

Personal Stacks


All Pages Stacked
IMG_0350.PNG
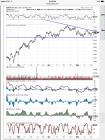
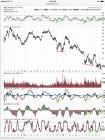
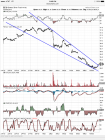
GDXJ - a repeat of December coming? A lot of similarities between then and now.

IMG_0349.PNG
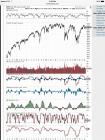
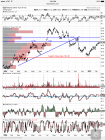
SLV - long term. Ok, this is really a stretch, but just for fun I tried to see if the recent action in sliver mim...
1

IMG_0348.PNG
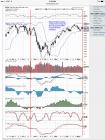
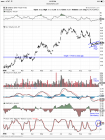
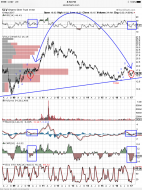
SLV - medium term. Forming the right hand shoulder of an irregular inverse head and shoulders? Ok, it's a stretc...

IMG_0347.PNG
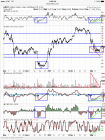
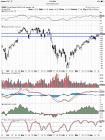
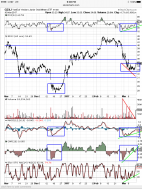
SLV - short term. Breaking out of falling wedge.
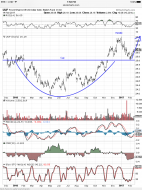
image.png
SLV - oh, by the way, here's the dollar chart. Not sure I ant to be all-in precious metals right now.
4
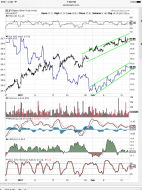
image.png
SLV - struggling to rise with the dollar. Will we see a repeat of November 2016?
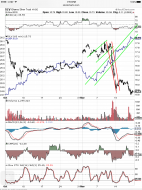
image.png
SLV - in November 2016, SLV rose alongside the dollar for a week or so before succumbing to the strength of he dollar.
1
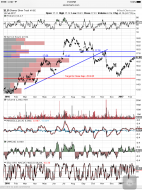
image.png
SLV - at resistance and a perfect spot for a right hand shoulder of a head and shoulders top.
1
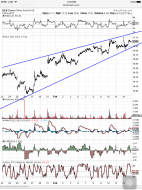
image.png
SLV - towards the end of a rising wedge.
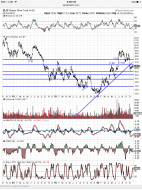
image.png
SLV - 3 year daily chart showing major support/resistance levels. Could we see a repeat of Oct - Nov of 2014 and...
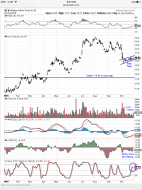
image.png
SLV - Looks like possible bear flag in formation, with a quick drop to the 14.65 area to close a gap, at which poi...
1
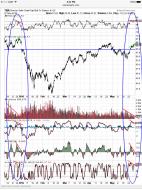
image.jpg
TNA - interesting comparison with December 2015. Everybody's bullish, bears are dead. We'll see. . .
1
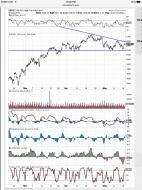
image.jpg
$SPX - no real reason to get too aggressive on the bullish side unless/until $SPX breaks upward out of this descendin...
1
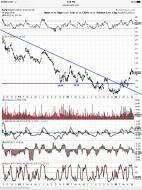
image.jpg
SLV - will it continue upward unabated ala late 2010 / early 2011, or will we see a pullback here? A pullback to...

image.jpg
$SPX - ignore the short term noise and look at the big picture. There really is not much bullish about this chart...