Users: vidivici: All Pages
IMG_0350.PNG
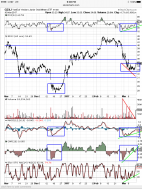
GDXJ - a repeat of December coming? A lot of similarities between then and now.

IMG_0349.PNG
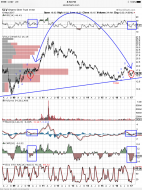
SLV - long term. Ok, this is really a stretch, but just for fun I tried to see if the recent action in sliver mim...
1
IMG_0348.PNG
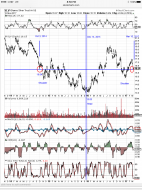
SLV - medium term. Forming the right hand shoulder of an irregular inverse head and shoulders? Ok, it's a stretc...
IMG_0347.PNG
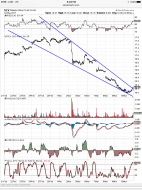
SLV - short term. Breaking out of falling wedge.
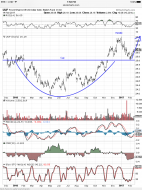
image.png
SLV - oh, by the way, here's the dollar chart. Not sure I ant to be all-in precious metals right now.
4
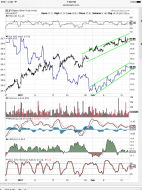
image.png
SLV - struggling to rise with the dollar. Will we see a repeat of November 2016?
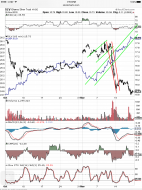
image.png
SLV - in November 2016, SLV rose alongside the dollar for a week or so before succumbing to the strength of he dollar.
1
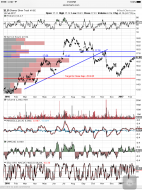
image.png
SLV - at resistance and a perfect spot for a right hand shoulder of a head and shoulders top.
1
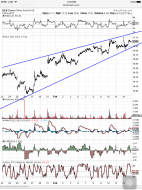
image.png
SLV - towards the end of a rising wedge.
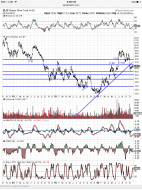
image.png
SLV - 3 year daily chart showing major support/resistance levels. Could we see a repeat of Oct - Nov of 2014 and...
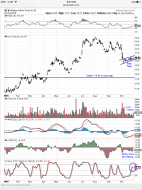
image.png
SLV - Looks like possible bear flag in formation, with a quick drop to the 14.65 area to close a gap, at which poi...
1
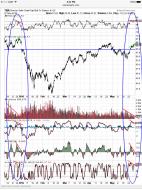
image.jpg
TNA - interesting comparison with December 2015. Everybody's bullish, bears are dead. We'll see. . .
1
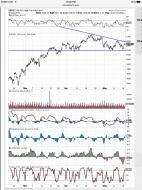
image.jpg
$SPX - no real reason to get too aggressive on the bullish side unless/until $SPX breaks upward out of this descendin...
1
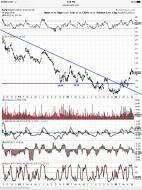
image.jpg
SLV - will it continue upward unabated ala late 2010 / early 2011, or will we see a pullback here? A pullback to...
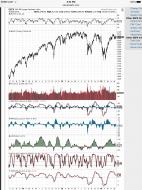
image.jpg
$SPX - ignore the short term noise and look at the big picture. There really is not much bullish about this chart...
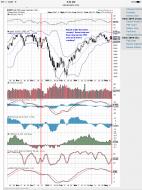
image.jpg
$SPX - repeat of last December coming up? A lot of similarities on the chart.
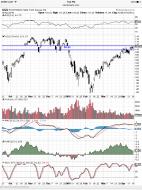
image.jpg
QQQ - entered the gap from December 31 on March 30 and still can't quite find the energy to close the gap. Now, t...
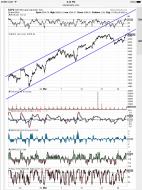
image.jpg
$SPX - Yellen jawbones $SPX up to the underside of the channel it has fallen out of. All talk, no action. Wonder...
1
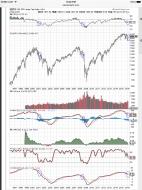
image.jpg
$SPX - don't lose sight of the big picture. Where we are now is analogous to the start of the second half of 2008.
6
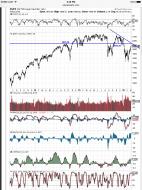
image.jpg
$SPX - watch the 2019 area as a possible ceiling for the current rally.
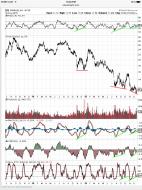
image.jpg
GG - positive divergences developing. Looking for a big pop over the next few weeks.
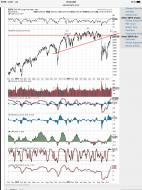
image.jpg
$SPX - right at two important levels of resistance and possibly beginning to map out the right shoulder of a massi...
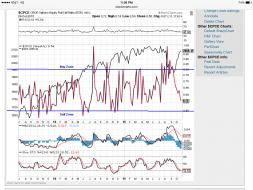
image.jpg
$SPX approaching sell zone per equity options put/call ratio. $SPX could rise a bit more here, but risk is clearl...
2
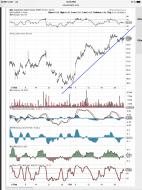
image.jpg
XLI - short term broken support providing resistance.
1
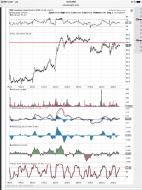
image.jpg
XLI - respecting the recent gap down.
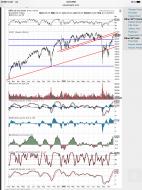
image.jpg
SPY - approaching underside of broken long term support.
1
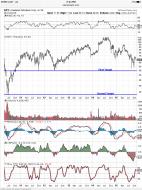
image.jpg
APC - massive head and shoulders playing out. Recent bounce looks to have topped out. Free fall could resume any...
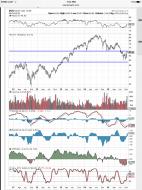
image.jpg
DOV - retesting neckline resistance. Another good low risk short entry, with a stop just above the neckline.
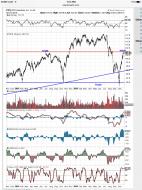
image.jpg
PPG - mapping out a right shoulder on a huge head and shoulders. Very low risk, high reward short entry here with...
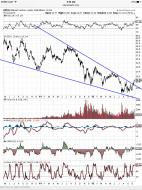
image.jpg
GDXJ - major breakout for minor miners.
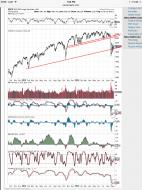
image.jpg
$SPX - looking for a very big upward move this week on the $SPX. Very positive developments in RSI, MACD, Slow St...
3
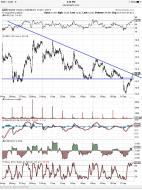
image.jpg
GDX - look out above. Breaking out of this triangle to the upside with a bear trap below the bottom horizontal co...
1
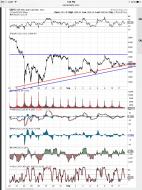
image.jpg
$SPX - for all of the short term bears out there, this chart is showing a series of higher lows since late August...
2
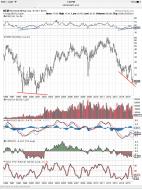
image.jpg
NEM - in addition to short term positiv divergences, NEM is also showing some potentially powerful long term divergen...
2
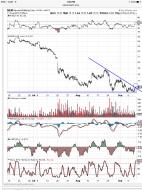
image.jpg
NEM - triple bottom breakout of a triangle on positive divergences. Could bounce quite a bit from here.
1
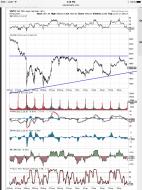
image.jpg
$SPX - watch the 1920 area on the $SPX tomorrow morning. A bounce in that area sets up a right angle, upward slop...
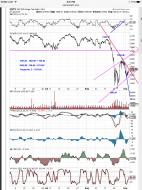
image.jpg
$SPX - butting up against the short term descending red resistance line. If it can't break the line tomorrow, new...
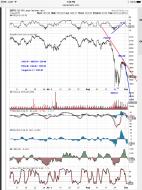
image.jpg
$SPX - I probably just jinxed it, but here is an update on my $SPX chart from Sunday. So far, so good, but I am s...
2
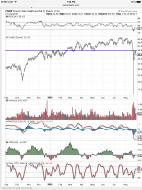
image.jpg
CURE - for the bears that are crazy enough to short a 3X bullish healthcare ETF, I give you CURE. Shorting this c...
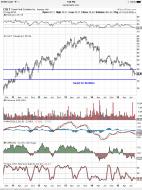
image.jpg
CVLT - pick your neckline - 40 or 31. Either way there is a magnet at 31, which is where I would expect at least...
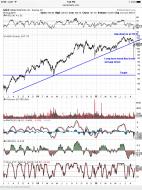
image.jpg
GILD - love this chart. Looking for a big fall at this point.
4
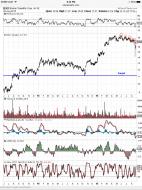
image.jpg
BSX - lower highs, one right after the other. Demonstration drop, followed by a quick rally to resistance.
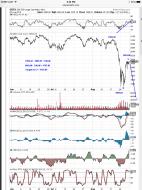
image.jpg
$SPX - not a prediction, more like a hope. I do think we will see a violent capitulation early this week, followe...
1
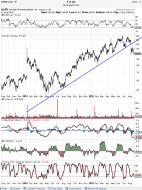
image.jpg
ALNY - follow up to Mike1981's post on ALNY. Clear ascending trendline break. Doubt it gets much above $110 on a...
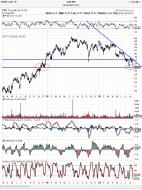
image.jpg
TYC - a bounce is likely here, as the $36 area has been key support/resistance in the past. Look to re-enter shor...
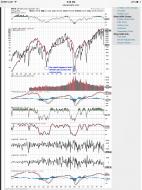
image.jpg
$SPX - per the $SPX/VIX ratio, we are likely due for a short term bounce, but we are a long, long way from "the bo...
1
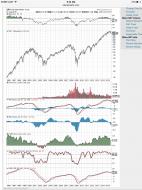
image.jpg
$SPY - anybody going long the market here (other than a bounce play) should take a good look at this chart and ask...
2
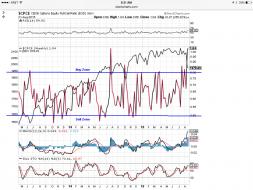
image.jpg
$SPX - equity options put/call ratio suggests that market is due for a bounce here. Playing the long side is risk...
1
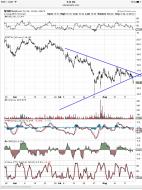
image.jpg
MTW - triangle break. Target is the $13.50 area.
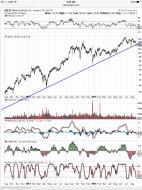
image.jpg
GILD - nice short setup just below broken support.
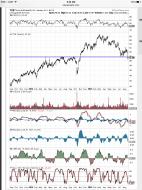
image.jpg
TXN - Retesting broken support. Nice short setup with good risk/reward if using a stop just above the broken support.
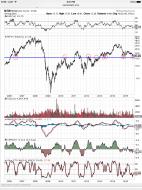
image.jpg
MTW - $16 area important long term support/resistance line for MTW. Working on a massive head and shoulders formatio...
2
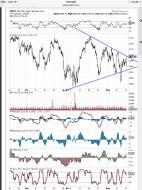
image.jpg
Decision time for $SPX.
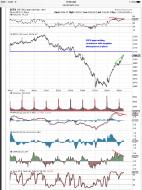
image.jpg
$SPX - approaching resistance with negative divergences on the 10 minute chart.
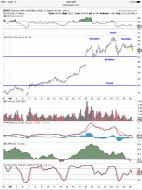
image.jpg
DUST - Head and shoulders playing out nicely so far.
1
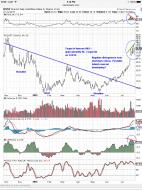
image.jpg
DUST - short term high in place (like Nov 2014)? Or will it power higher (like it did from mid-April to June of 2...
3

image.jpg
INTC - here's the chart for INTC showing the H&S with a target of $22.50.
1
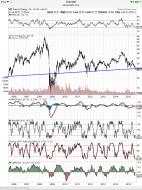
image.jpg
SU - at long term support. A break here would be very bearish.
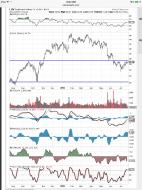
image.jpg
LUV - butting up against resistance. Good risk/reward for short entry.
1
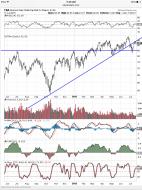
image.jpg
TNA - kissing underside of broken upward trend line. Could fall along way from here.
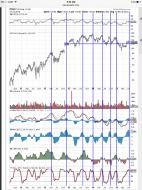
image.jpg
PVH - repeating wave history with PVH. If history repeats, look for a decent move down from here.
1
image.jpg
Filed under the "humor" stack for obvious reasons. . .
5
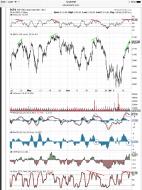
image.jpg
$SPX - As noted by others, negative divergence now in place for $SPX on the 60 minute chart. Risk/reward ratio do...
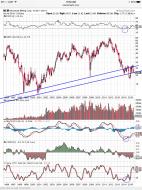
image.jpg
NEM - at long term support. Bounce or break?
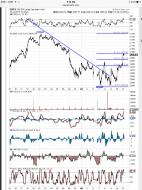
image.jpg
$SPX hitting resistance at 61.8% retrace of June 22nd high.
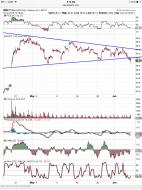
image.jpg
MSFT update - breaking down out of clearly defined triangle. Target of $42.50
1
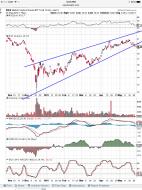
image.jpg
RSX - following up on TK's RSX short. Falling out of a rising wedge. If December is any guide, this one could fa...
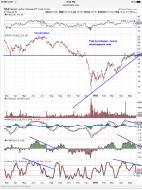
image.jpg
RSX - TK mentioned this trade on Tasty Trade earlier. A big fall in RSX may be coming if past is prologue. If so...
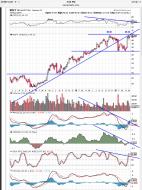
image.jpg
MSFT - Update. Rising into the underside of horizontal and ascending trendline resistance. Negative divergences...
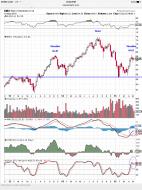
image.jpg
BMO - Update. Head and shoulders playing out nicely so far.
1
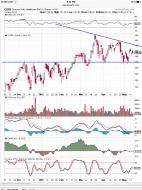
image.jpg
CURE - Daily chart shows nice descending triangle, with clear support/resistance. Target of 115.
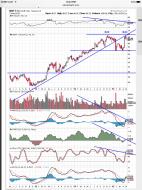
image.jpg
MSFT - update on MSFT. Topping process underway. Could bounce a bit further from here, but not likely to break ba...
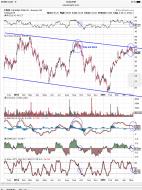
image.jpg
CSIQ - update from initial post two days ago. Earnings now out of the way. Past is prologue. Look out below.
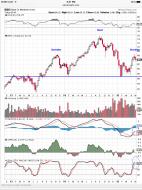
image.jpg
BMO - love this head and shoulders set up. The chart speaks for itself. Not much more to say.
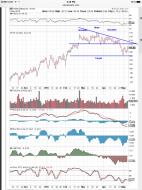
image.jpg
HD - Update on HD. Came very close to initial target of 106. Now looks to retest neckline or downtrending line o...
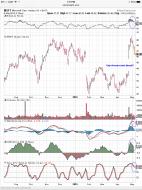
image.jpg
MSFT - Update from the weekly MSFT chart I posted on May 1st. Could find support around 45, but may just keep goi...
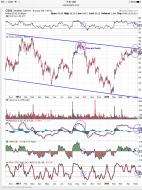
image.jpg
CSIQ - guess what happens next?
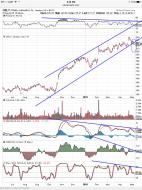
image.jpg
ORLY - falling out of long term up channel. Negative divergences as well. Auto parts store up 10x from low in 20...
1
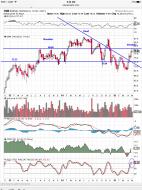
image.jpg
EMN - currently tracing out top of right shoulder. Set stop just above 80.68 (top of left shoulder and point of p...
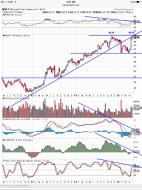
image.jpg
MSFT - like it for puts as it tests underside of long term ascending trend line. Also could be establishing a nic...
1
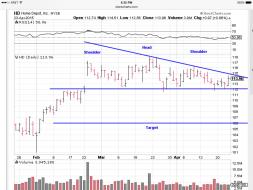
image.jpg
HD - Head and Shoulders formation on the daily chart. Negative divergences on the weekly and dojis at the top on...
1
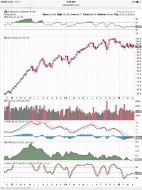
image.jpg
JNJ - long term negative divergences all over the place, nice topping pattern, and nothing but air down to $92.50....
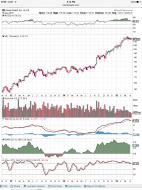
image.jpg
HD - another short candidate. This one's more of a flyer, so consider using a tight stop if you go short. What I...
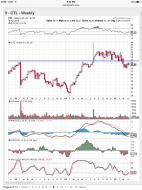
image.jpg
CTL - back below resistance, and lots of overhead supply above $37.
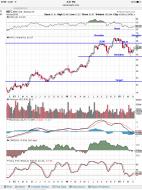
image.jpg
INTC - looking to short in the $35 area upon completion of right shoulder.
2
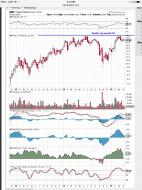
image.jpg
image.jpg
WDC - Short around $100.50 with a tight stop.
image.jpg
Gotta luv this short candidate. Good one for puts.
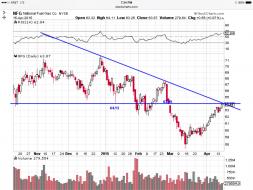
image.jpg
1