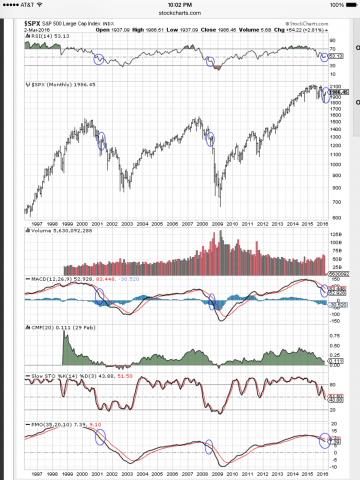
If you are going to use indicators, at least know what they mean. When the MACD crosses over from a high level, it means one of two things: 1) strong downtrend or bear market, 2) consolidation / sideways action. Notice that in 2000 and 2008 that by the time the MACD had crossed over this much, the market was already down 30%+. Notice now that the market is only down about half that. What does that tell us? It tells us that this is sideways consolidation action and NOT a bear market. 3/3/16
Very similar to a chart I posted a couple of weeks back. Dink's points are valid considerations, but I disagree that the current MACD can only be an indicator of a consolidation and not a bear market. The MACD itself isn't an indicator of trend change; it can validate (or not) actual indicators such as price movements. Per my earlier chart, there's historical precedence suggesting that if the 12/20 SMAs crossover on the monthly chart, that's the indicator and the MACD would be lending support to the bear market argument. My $0.02. YMMV. 3/3/16


3/2/16