User: Price Pays: SPY
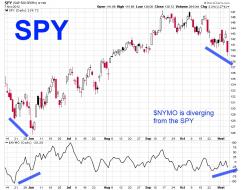
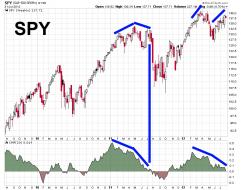
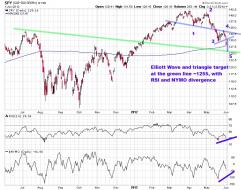
SPY NYMO divergence Nov 7 2012.jpg

2
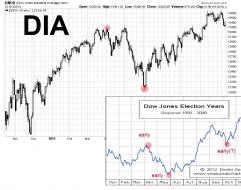
DJIA Oct 12.jpg
Election year seasonality - the NA indexes could be headed higher soon
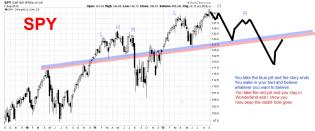
SPY September 9 long term.jpg
SPY weekly long term guesstimate. The blue pill or the red pill?
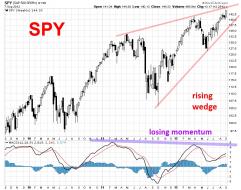
SPY September 9.jpg
SPY weekly. Rising wedge and losing momentum
1
SPY July 31 divergence.jpg
SPY is diverging hard from the CMF(20) again....
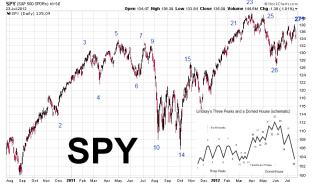
SPY Three Peaks and a Domed House July 2012.jpg
3 Peaks and a Domed House setting up. Credit to Carl Futia blog for spotting this in April
13
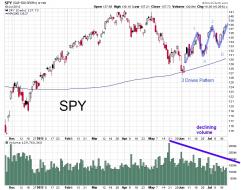
SPY July 19 3 Drives.jpg
3 drives pattern on declining volume
SPY road map Summer 2012.jpg
SPY guesstimate road map for Summer 2012
1
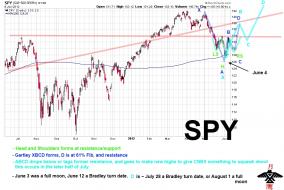
SPY 20120603.jpg
Elliott Wave and triangle break projection target