User: Price Pays
Member Since: 6/1/12
Instruments
Price Pays's Profile
Personal Stacks


All Pages Stacked
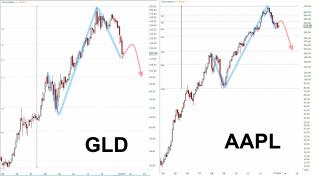
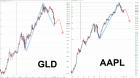
GLD AAPL 2013.07.03 comparison.jpg
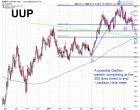
GLD vs. AAPL ... what would you rather own? A 10oz bar or iPhone 6? Who would win a in fight? A gold nut with a ba...

2
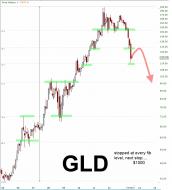
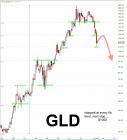
GLD 2013.07.03 Fib levels drawn in.jpg
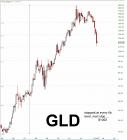
GLD with fib levels drawn in
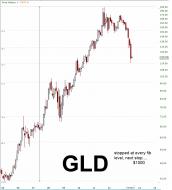
GLD 2013.07.03 Fib levels.jpg
Gold bounces off fib levels. Gold nuts heads explode
1
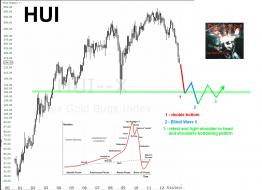
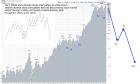
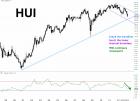
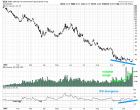
HUI 2013.05 Fear Emptiness Despair.jpg
FEAR EMPTINESS DESPAIR (Twist the Knife slowly)
3
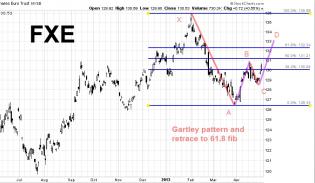
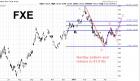
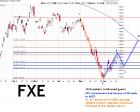
FXE 2013.04.30 Gartley retrace.jpg
FXE - Gartley and 61.8 fib retrace
1
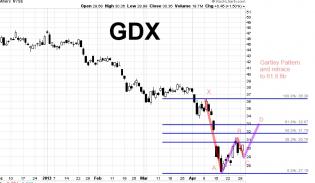
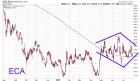
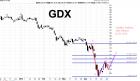
GDX 2013.04.30 Gartley retrace.jpg
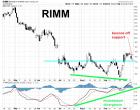
GDX - for all those wanting to get back in short. 61.8 fib retrace
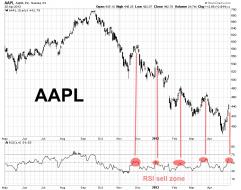
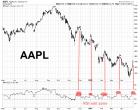
AAPL 2013.04.30 RSI sell zone.jpg
RSI back in the "sell" zone? Higher high in place, now needs to make lower low. Hello $420

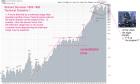
HUI 2013.02.22 channel and more pain ahead.jpg
HUI GDX - long term more pain ahead

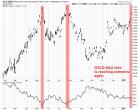
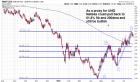
GLD to XAU ratio Jan 24.jpg
Gold : XAU ratio is reaching extremes
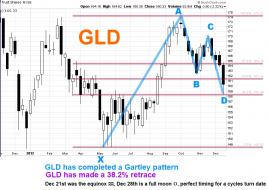
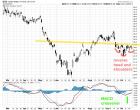
GLD Gartley Dec 23.jpg
$GLD has completed a Gartley Pattern on the weekly, retraced 61.8%, and Dec21st could be a turn date
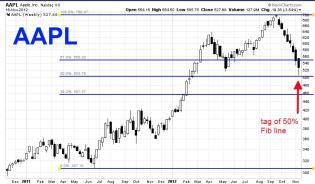
AAPL 50 retrace.jpg
AAPL has made a perfect 50% retrace of its June'11-Sept'12 rally. Right shoulder heeeeere we come
1
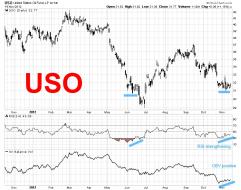
USO November 14.jpg
USO has a positive diverging RSI and OBV
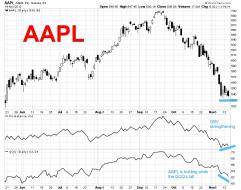
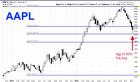
AAPL November 14.jpg
Apple looks like it's going to lead the market higher as it's showing relative strength
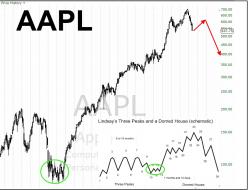
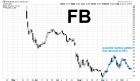
AAPL November 2012.jpg
$400 for the head and shoulders, then $250 for the midpoint consolidation of 100-700. FU iTunes.
3

USO FXC divergence Nov 7 2012.jpg
USO is diverging from the rising loonie. Loonie usually tracks oil. A bottom for USO?