Users: Price Pays: All Pages
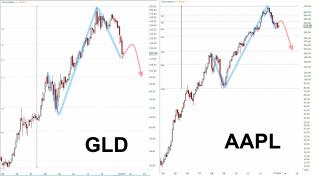
GLD AAPL 2013.07.03 comparison.jpg
GLD vs. AAPL ... what would you rather own? A 10oz bar or iPhone 6? Who would win a in fight? A gold nut with a ba...

2
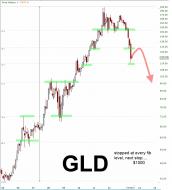
GLD 2013.07.03 Fib levels drawn in.jpg
GLD with fib levels drawn in
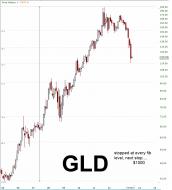
GLD 2013.07.03 Fib levels.jpg
Gold bounces off fib levels. Gold nuts heads explode
1
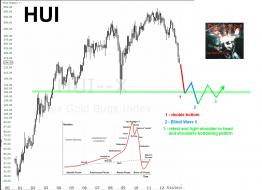
HUI 2013.05 Fear Emptiness Despair.jpg
FEAR EMPTINESS DESPAIR (Twist the Knife slowly)
3
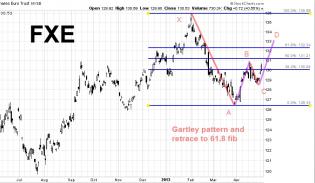
FXE 2013.04.30 Gartley retrace.jpg
FXE - Gartley and 61.8 fib retrace
1
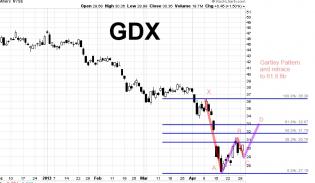
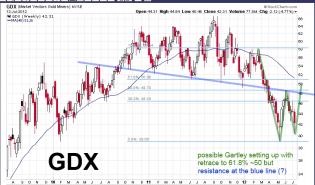
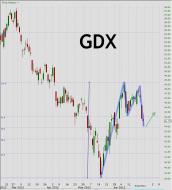
GDX 2013.04.30 Gartley retrace.jpg
GDX - for all those wanting to get back in short. 61.8 fib retrace
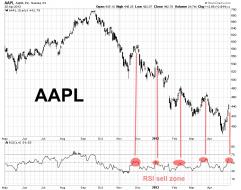
AAPL 2013.04.30 RSI sell zone.jpg
RSI back in the "sell" zone? Higher high in place, now needs to make lower low. Hello $420
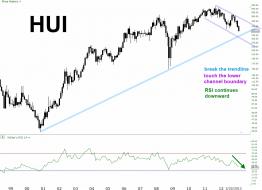
HUI 2013.02.22 channel and more pain ahead.jpg
HUI GDX - long term more pain ahead
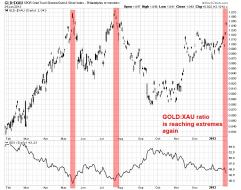
GLD to XAU ratio Jan 24.jpg
Gold : XAU ratio is reaching extremes
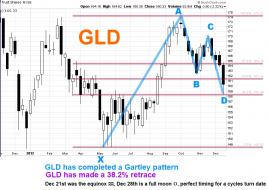
GLD Gartley Dec 23.jpg
$GLD has completed a Gartley Pattern on the weekly, retraced 61.8%, and Dec21st could be a turn date
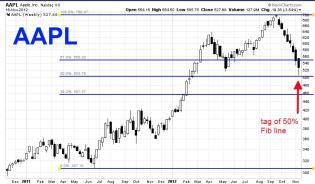
AAPL 50 retrace.jpg
AAPL has made a perfect 50% retrace of its June'11-Sept'12 rally. Right shoulder heeeeere we come
1
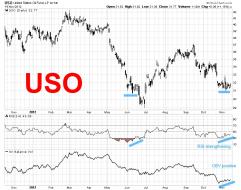
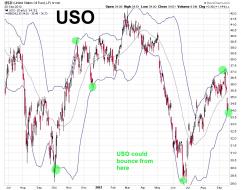
USO November 14.jpg
USO has a positive diverging RSI and OBV
AAPL November 14.jpg
Apple looks like it's going to lead the market higher as it's showing relative strength
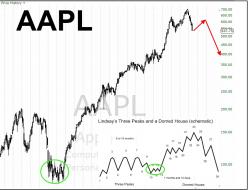
AAPL November 2012.jpg
$400 for the head and shoulders, then $250 for the midpoint consolidation of 100-700. FU iTunes.
3

USO FXC divergence Nov 7 2012.jpg
USO is diverging from the rising loonie. Loonie usually tracks oil. A bottom for USO?
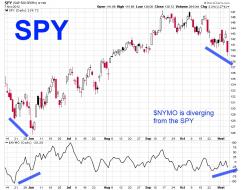
SPY NYMO divergence Nov 7 2012.jpg
2
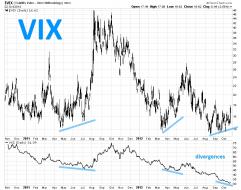
VXX October 22.jpg
VXX is diverging from the medium term VXZ.
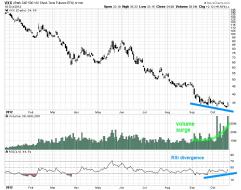
VXX October 19.jpg
VXX has RSI divergence and volume surge..hmmm
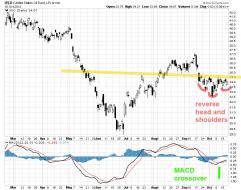
USO October 18.jpg
possible reverse head and shoulders in USO
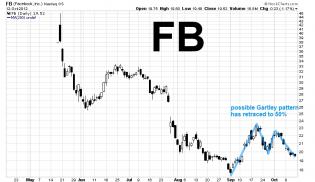
FB Oct 12.jpg
Facebook completing a Gartley? It has retraced 50% and closed the gap
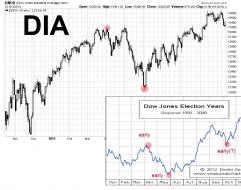
DJIA Oct 12.jpg
Election year seasonality - the NA indexes could be headed higher soon
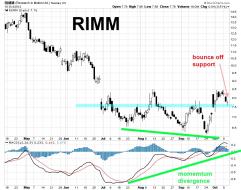
RIMM.jpg
RIMM bounce off support
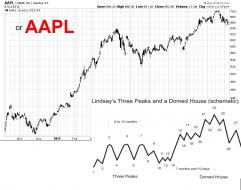
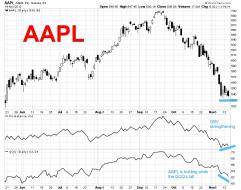
AAPL October 5.jpg
AAPL looks like a 3 peaks and a domed house. I despise iTunes
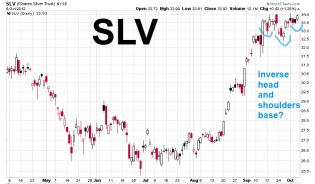
SLV October 4 hns.jpg
possible inverse head and shoulder base on SLV
1
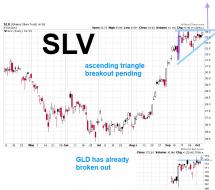
SLV October 4.jpg
SLV to break ascending triangle, GLD already has
USO September 20.jpg
USO should bounce off it's BB(34,2)
SLV vs. COTs September 2012.jpg
SLV vs. the COTs. Managed rise if you ask me.
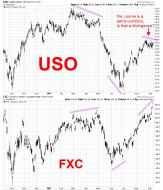
USO FXC divergence September 2012.jpg
USO and FXC diverging when they are correlated 88% of the time
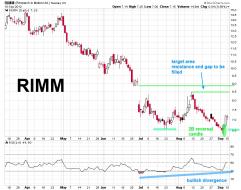
RIMM.jpg
RIMM making a Sperandeo 2B reversal. AAPL down and RIMM up for a short time? When was the last time that happened?
1
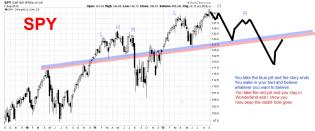
SPY September 9 long term.jpg
SPY weekly long term guesstimate. The blue pill or the red pill?
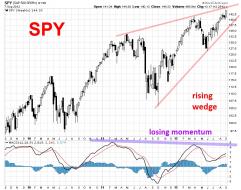
SPY September 9.jpg
SPY weekly. Rising wedge and losing momentum
1
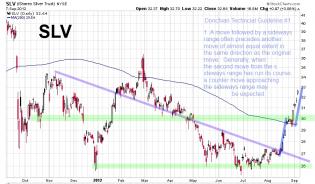
SLV September 9.jpg
Donchian T1 move complete. Retrace to 200 dma and support at 30?
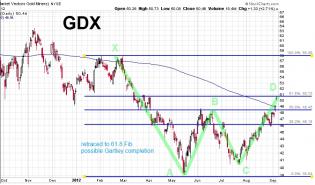
GDX September 9.jpg
GDX has retraced 61.8%. Short term pull back to 200dma?
INDU 3 domes and a peaked house August 2012.jpg
more Pattern Pr0n. 3 domes and an omg
INDU T1 move August 2012.jpg
some pattern pr0n. Who says things can't get "that" bad?
GLD August 24.jpg
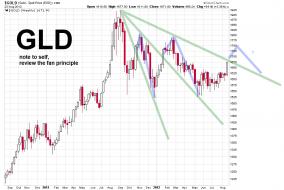
fan principle
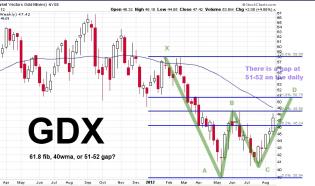
GDX August 24.jpg
can it retrace to the 61.8, 40wma, or 51-52 gap on the daily?
UUP August 23 trendline.jpg
just noticed the green trendline
1
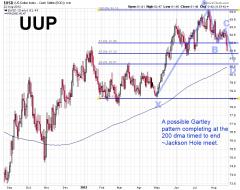
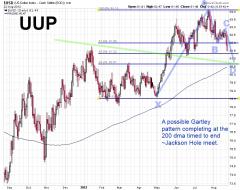
UUP August 23.jpg
possible Gartley completion at 200dma
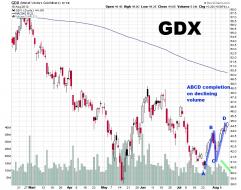
GDX August 11.jpg
GDX ABCD complete on declining volume
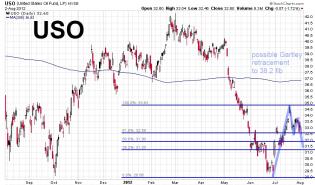
USO August 2.jpg
USO guesstimate to return to 61.8 Fib
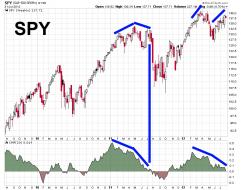
SPY July 31 divergence.jpg
SPY is diverging hard from the CMF(20) again....
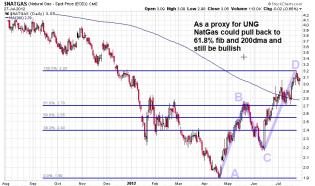
UNG July 30.jpg
As a proxy for UNG - $NatGas could pull back to 61.8% fib and 200dma and still be bullish
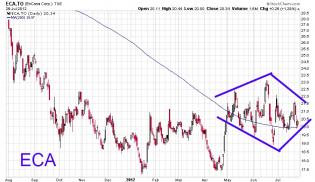
ECA July 26.jpg
diamond pattern (?)
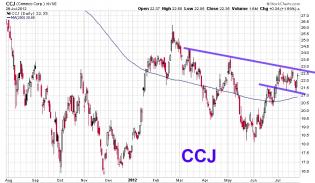
CCJ July 26.jpg
pennant pattern setting up
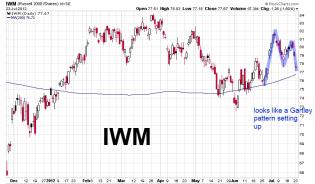
IWM Gartley.jpg
possible Gartley setting up in the IWM
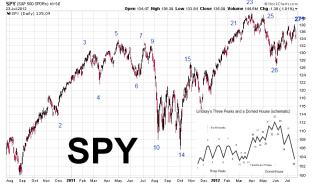
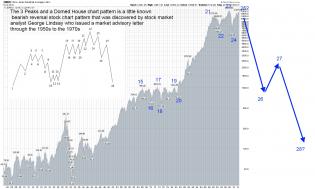
SPY Three Peaks and a Domed House July 2012.jpg
3 Peaks and a Domed House setting up. Credit to Carl Futia blog for spotting this in April
13
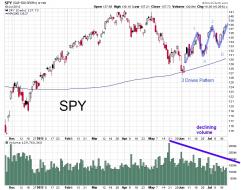
SPY July 19 3 Drives.jpg
3 drives pattern on declining volume
GDX July 15.jpg
GDX - possible Gartley completion to 61.8 fib retrace
GLD July 11.jpg
GDX Gartley June 2012.jpg
GDX making a Gartley type retracement, it could make a flag in the next few days
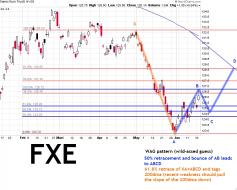
FXE June 2012 WAG.jpg
WAG Pattern to retrace to 200 dma, one small Gartley leads to a larger one
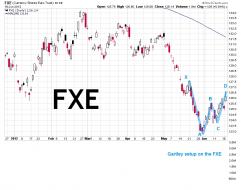
FXE Gartley June2012.jpg
FXE is completing a Gartley if it swings lower
SPY road map Summer 2012.jpg
SPY guesstimate road map for Summer 2012
1
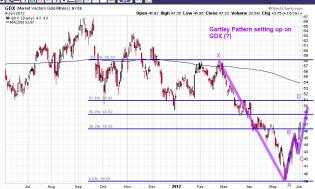
GDX 20120604 Gartley.jpg
possible Gartley forming in the GDX?
1
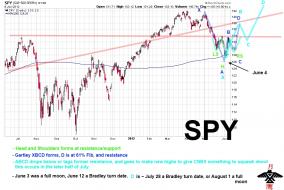
SPY 20120603.jpg
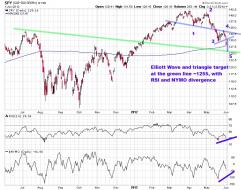
Elliott Wave and triangle break projection target