Log In
|
Create Account
Chart
Chart Lab
Drawn Objects ➟
Earnings Reactions
Guide to Patterns ➟
Modes ➟
Power Features ➟
Rotation Graphs
SlopeCharts
Videos for SlopeCharts
Yield Curve
Equities
Biggest Stocks
Calendar of Earnings
Correlations
Earnings ➟
Historical Earnings
Market Capitalization
Power Screener
Super Summary
Volume/Price Leaders
Woulda Shoulda
Markets
Automatic Reports
Commodities
CryptoStream LIVE
Economic Database
Global Economics
Macroeconomics
Market Meter
MetaSymbols
Quad Matrix
SlopeRules
Options
Analytics ➟
Backtest Strategies
Earnings Calendar
Extreme Options
Historical Charts
Matrix of Volatility
Open Interest & Volume
Payoff Analyzer
Strategy Explorer
Volatility Calendar
Read
Best Posts of All Time
Books by Tim Knight
Comments Search
Guide to Comments
Latest Posts
Mobile Apps
Profile of Your Host
Recommended Books
Ticker Stripper
Trading Rules
Social
Activity Feed
Browse Chart Database
Hall of Fame
Members Directory
Publishing/Subscribing
Recent Activity
Search SlopeRules
Shared Labels & Lists
SlopeTalk LIVE
Trader’s Diary
Help
Best Pages for You
Charts Overview
Guide to the Site
Membership Levels
Pattern Video Library
Power Screener Guide
Premium Memberships
SlopeCharts Reference
Using SlopeTalk Chat
Video Tutorial
Log In
Create Free Account
Memberships
User:
Price Pays
: GDX
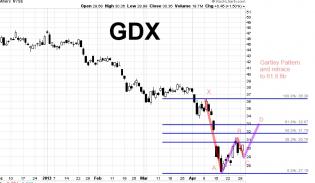
GDX 2013.04.30 Gartley retrace.jpg
GDX - for all those wanting to get back in short. 61.8 fib retrace
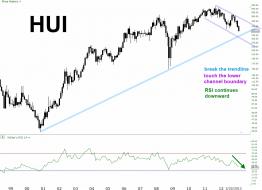
HUI 2013.02.22 channel and more pain ahead.jpg
HUI GDX - long term more pain ahead
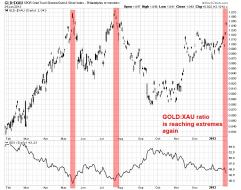
GLD to XAU ratio Jan 24.jpg
Gold : XAU ratio is reaching extremes
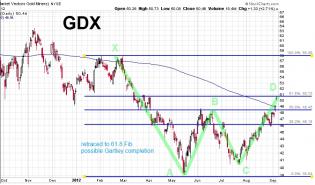
GDX September 9.jpg
GDX has retraced 61.8%. Short term pull back to 200dma?
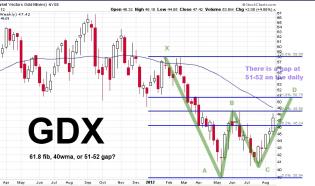
GDX August 24.jpg
can it retrace to the 61.8, 40wma, or 51-52 gap on the daily?
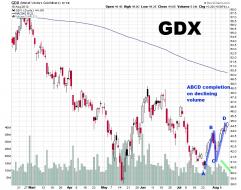
GDX August 11.jpg
GDX ABCD complete on declining volume
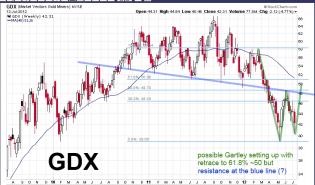
GDX July 15.jpg
GDX - possible Gartley completion to 61.8 fib retrace
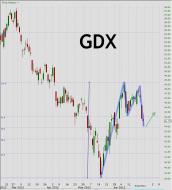
GDX Gartley June 2012.jpg
GDX making a Gartley type retracement, it could make a flag in the next few days
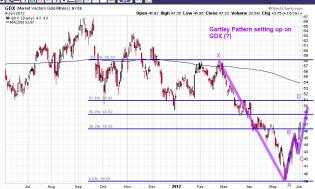
GDX 20120604 Gartley.jpg
GDX Gartley forming?
1