User: Censored

All Pages Stacked
achart.jpg

2
Screen Shot 2013-09-13 at 7.32.03 PM.png
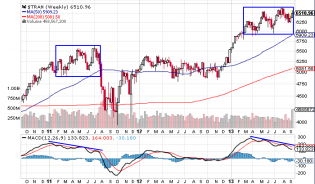
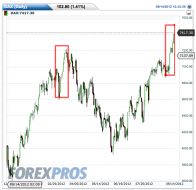
Weekly trannies. Same divergence as in 2011.
Flag.png
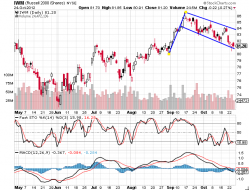
IWM Bull Flag? It looks quite text book. IWM bounced off of the 200 MA 2 days ago and held and looks full of energ...
1
DAX Bullflag.png
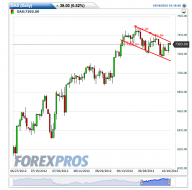
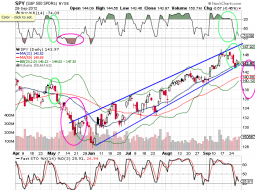
DAX bull flag alert
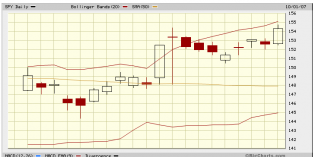
Bull Flag.png
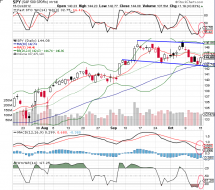
Potential bull flag on SPY. enough energy is built up for a potential move to the top of the channel. A break-out...
October.jpg
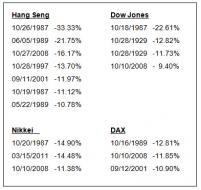
October stock market dive history...This October may get interesting yet ;-)
commercial.gif
smart money?
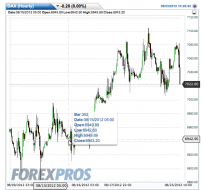
SPY Project.png
If SPY breaks the channel we can see a repeat of the May correction, target 138-140

QE4.png
Here we go, QE4. Not kidding.
SPY 2007 Sept.png
#DAX.png
This last stretch looks EXACTLY like the one back in February/March.

marriage.jpg
DAX 8-23.png
This thing is going down.

VIX.png
2
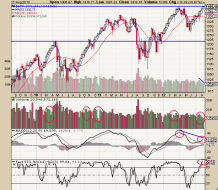
SPX 8-20.png
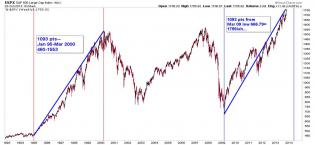
Bull party almost over. Weekly chart shows much weaker advance versus spring. Weekly overbought. 1,220 IT target.