Users: Censored: All Pages
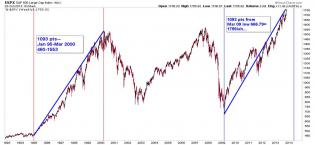
achart.jpg

2
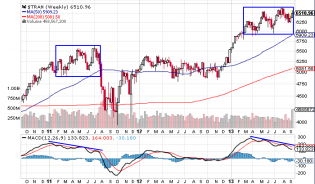
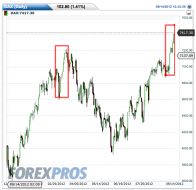
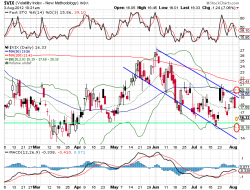
Screen Shot 2013-09-13 at 7.32.03 PM.png
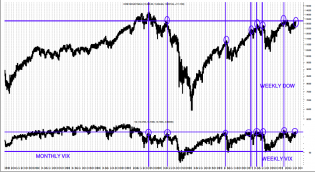
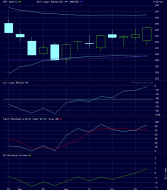
Weekly trannies. Same divergence as in 2011.
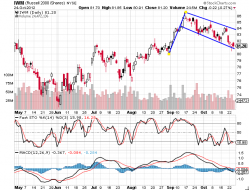
Flag.png
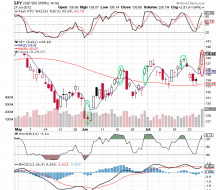
IWM Bull Flag? It looks quite text book. IWM bounced off of the 200 MA 2 days ago and held and looks full of energ...
1
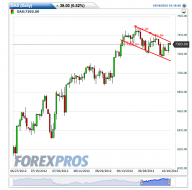
DAX Bullflag.png
DAX bull flag alert
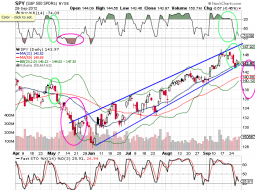
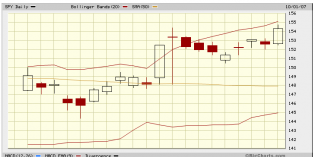
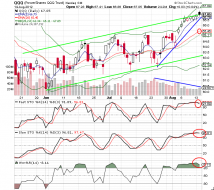
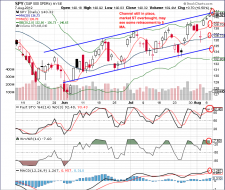
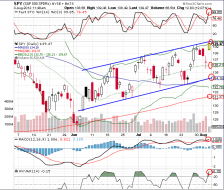
Bull Flag.png
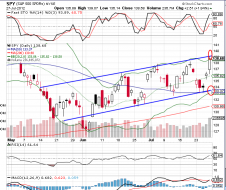
Potential bull flag on SPY. enough energy is built up for a potential move to the top of the channel. A break-out...
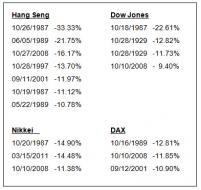
October.jpg
October stock market dive history...This October may get interesting yet ;-)
commercial.gif
smart money?
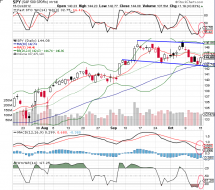
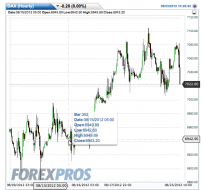
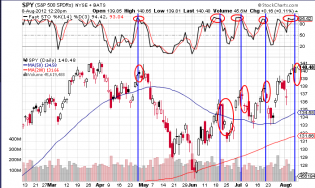
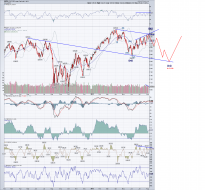
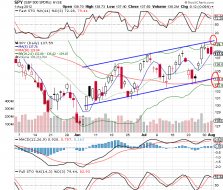
SPY Project.png
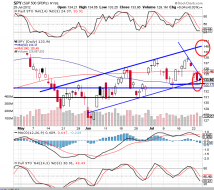
If SPY breaks the channel we can see a repeat of the May correction, target 138-140

QE4.png
Here we go, QE4. Not kidding.
SPY 2007 Sept.png
#DAX.png
This last stretch looks EXACTLY like the one back in February/March.

marriage.jpg
DAX 8-23.png
This thing is going down.
VIX.png
2
SPX 8-20.png
Bull party almost over. Weekly chart shows much weaker advance versus spring. Weekly overbought. 1,220 IT target.
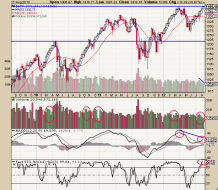
8-14 QQQ.png
Very large divergence between price and volume. Black bar and overbought conditions indicate possible retracement...

bull.png
My cue to short AAPL and GOOG today. The AAPL puts netted over 50% gain. Tweets like this are pure bear meat.
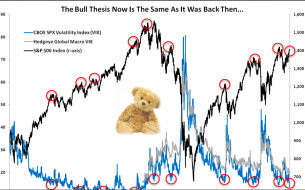
Bull Thesis.png
Go long if you are so inclined, just know this.
1
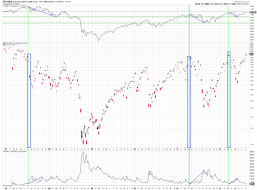
SPy-Vix.png
SPY 8-13.png
We have arrived. Short at will.
2
QQQ 8-9.png
6 consecutive green days on the QQQ. Rare. Expecting red soon.
SPY 8-8 pullbacks.png
We are on the longest stretch of ST overbought in 6 months. Each time a pullback occurred. Expect one shortly.
1
SPY 8-7.png
Channel still in play. Markets are overbought ST and we may see a initial retracement to the 5 MA this week. I exp...
S&P 8-6.png
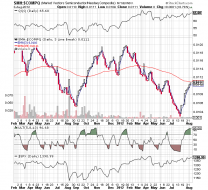
SMH-COMPQ.png
This chart makes me want to test shorts this Monday
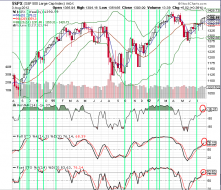
SPX 8-3 weekly.png
A weekly SPX chart reveals that the market has been experiencing 4 weeks of positive results in a row. Weekly tren...
SPY 8-3.png
Spy at channel top, could feasibly move a bit higher, but very ST overbought on low volume. Some backing and filin...
VIX 8-3.png
Vix says this rally has some more legs. Low 15s may be a goo place to start shorting the market, channel points to 14.
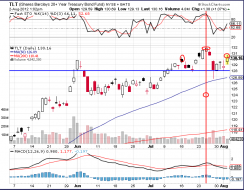
TLT 8-2.png
TLT showing a potential H&S pattern with target to 124..
SPY 8-1.png
Futures are being ramped hard overnight, at this point I have to expect a big gap up into the 140-141 range, this...
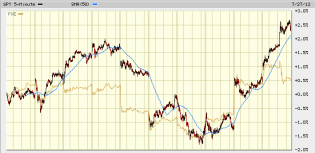
SPY:FXE 7-27.png
Euro/$ diverged Friday afternoon. A few days earlier we had a similar divergence only to see it balanced out again...
SPY Weekly 7-29.png
3 month SPY weekly shows market overbought on weekly basis for Fast Stochastic and Williams %R. OBV shows accumulatio...
July 29.png
Channel intact, upper channel reached per chart from July 26. Further push higher seems entirely predicated on gov...
2
5 MA Divergence July 29.png
5 day MA is very stretched. Some filling/retracement likely..
2
Spy 7-26.png
SPY back in channel with today's ECB announcement. A run toward 140 remains a distinct possibility.