View: SPX 8-3 weekly.png
SPX 8-3 weekly.png
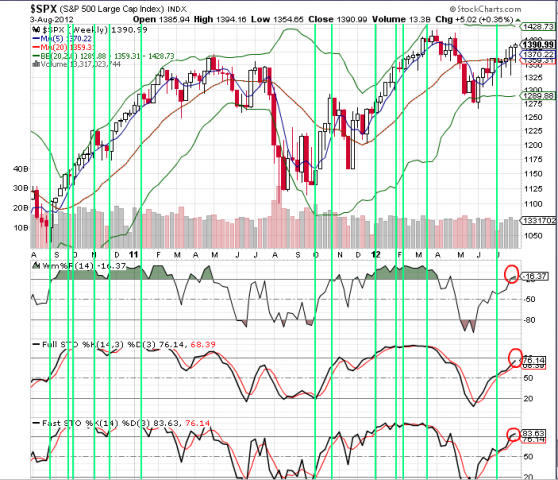
A weekly SPX chart reveals that the market has been experiencing 4 weeks of positive results in a row. Weekly trends like this are not uncommon, however they tend to at least stop after 4 or 5 weeks either resulting in a complete reversal or a breather. Weekly stochastics and Williams curves suggest the rally has indeed potential for another week of up moves likely resulting in total overbought and full overbought levels sometime this week. The top end of such a move would possibly be at the upper Bollinger of 1,428 or so. Given short term overbought we may see some initial weakness in the week, i.e. Monday followed by a strong up push. I will look for any accelerated move into 1,420s to short into heavily.
Comments
No comments yet.

