Users: daButcher: All Pages
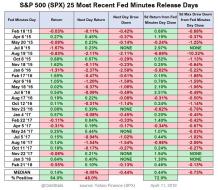
PostFOMCminutes.jpg
Post FOMC performance last 25 events

1
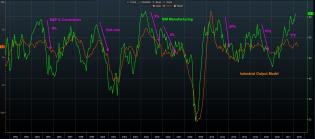
SPXISM.jpg
Once again ISM has diverged massively vs our underlying industrial model. This leaves us wondering if its really m...
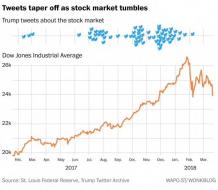
TrumpTweets.jpg
Who says it's impossible to time the market, bullshit.
2
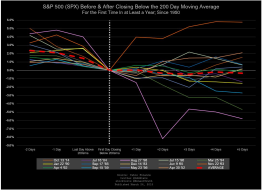
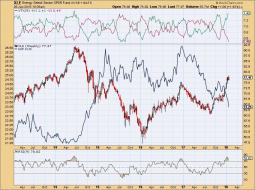
$VIX$SPY.png
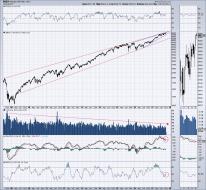
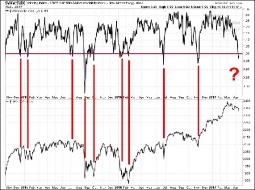
If $SPX closes this coming week below the 200sma, it will be the first time since Jun '16. But is that a short-ter...
2
MOMO23.jpg
Momentum Indicator Warns OF STOCK MARKET DANGER
3
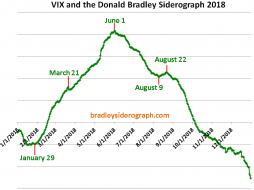
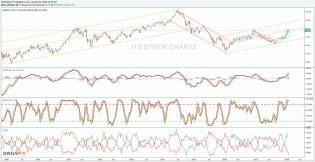
A1-VIX-Bradley-Siderograph-2018-Turn-Dates.png
VIX – 2018 Bradley Siderograph Turn Dates
2
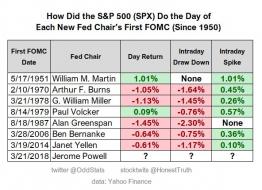
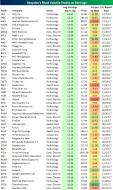
FED test.jpg
Here's every Fed Chair since 1951, and how the market performed on their first day. Jerome Powell will be tested i...
$TNX2.jpg
$TNX events
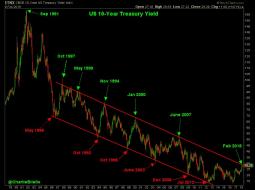
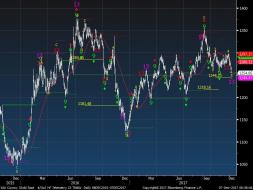
$TNX.jpg
$TNX leads $XLU follows, both obey lord and master king $$ $UUP
ES.jpg
Dealer positioning in ES futures has historically been useful. Currently at a 6yr net short extreme
1
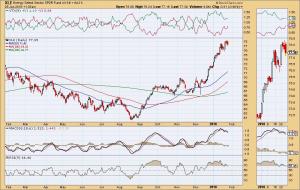
XLE4.jpg
1
XLE3.jpg
XLE2.jpg
XLE1.jpg
1
goldFUTURES.jpg
Gold futures contract has a downside DeMark exhaustion signal today. As posted on Hedge Fund Telemetry daily note today
1

BITcoinsouthkorea.jpg
A bitcoin frenzy like no other is gripping South Korea, bombed by the north the worry, another bomb heading your way.
1
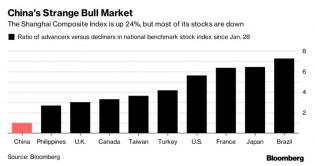
CHINA.jpg
Every bull market is unique, but the one in China right now looks downright strange....the stock market in China i...
highestREVearningsplayweek.jpg
@DOCSTRANGE, let's get crazy: These are the highest revenue generating companies reporting earnings this week.
1

value.jpg
Over the last 4 weeks there has been a resurgence in value strategies. Going into November, factor leadership was...
1

stocksbonds6040.jpg
Stock and bond markets have been extraordinarily quiet since February 2016 lows. How quiet? A 60/40 portfolio cons...

stocksvsbonds.jpg
The last time equities outperformed bonds for 7 straight years was 1928
2
putcallratio.png
10 day...
3
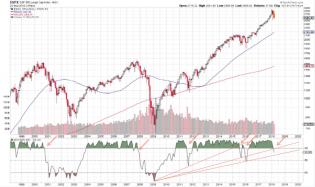
$SPXsupertrends.jpg
$SPX up 7 weeks in a row. Up 8 weeks just once since 2003; gained 0.06%. Up 9 weeks at start of 2003-07 bull marke...
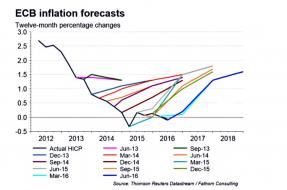
ECBinflation.jpg
Central Banks Have Consistently Failed At Predicting Inflation and Growth, Why Believe Them Now?
1
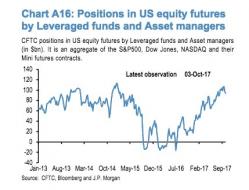
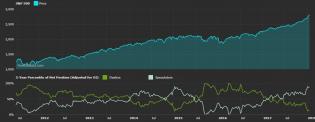
SPXfutures.jpg
Hedge funds and asset managers haven't been this net long US equity futures since 1Q15
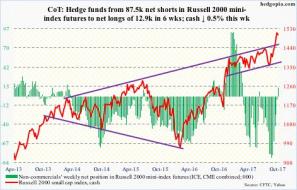
hedgehogs&therutty.jpg
For 1st time in 17 weeks, #hedgefunds net long $RUT futures, even as cash showing signs of fatigue after huge run. $IWM

Lumber.jpg
As NAFTA talks turn ugly, lumber futures soar to 13-year high
1

creditlosses.png
Increasing credit losses as the FOMC raises rates, either the curve screams higher on the long end or we all fall...

Treasury-Bund Spread .jpg
Treasury-Bund Spread Says Dollar Has More Room to Fall
1
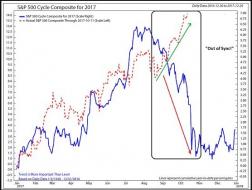
S&Pcyckes.jpg
Market has laughed at the "typical seasonal weakness" story this year. Won't stop folks from talking up "typical s...
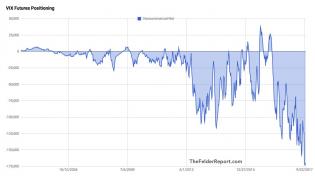
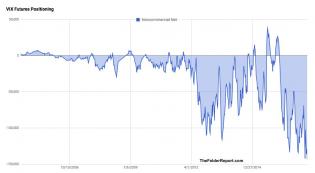
VIXfutures.jpg
Another new record in noncommercial net shorts in $VIX futures: Expect zombie-like action until a geopolitical cat...
4
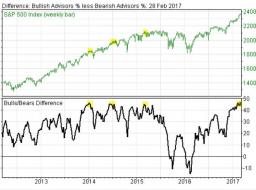
SPXweekly.jpg
Other times since 2009 that newsletter bulls-bears spread was >45%. Last time was March ($SPX fell 3% during month)
NAS100.jpg
Nasdaq 100 weekly divergence stacking up.
MACD, money flow, volume.
Rising wedge formation

REXit.jpg
REXit
1

M&Apeaked.jpg
Global M&A activity has slowed and likely peaked.
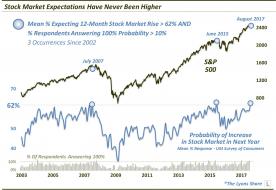
expectations all time high.jpg
A record percentage of people think the stock market will rise over the next 12 months
2
MChammer.jpg
The stock market has become excessively calm and quiet, befitting a meaningful top.
2
highestVOLearnings.jpg
Highest VOL post earnings report

$VIX downside exhaustion.jpg
$VIX downside exhaustion
2

LTCperspective.jpg
LTC perspective of the move BIGHOUSE
2

$VXO2.jpg
The closing quote monkey business in VXO continues this week. Today should have been new closing low, but "somebod...
1

$VXO.jpg
Something screwy going on lately in VXO quotes. Somebody painting the tape at the close?

TommyBoy.jpg
9-13-9 Sequential sell signal during a strong uptrend was one of the most powerful sell signals there is
1

IBB.jpg
$IBB target short

endofQoutofbonds.jpg
End of Q out of bonds, systematic walk down-----KGS

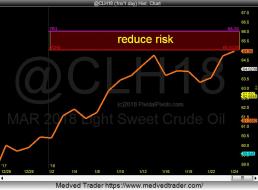
CrudeCRAP.jpg
If there was a mercy rule in financial markets, we may have already called it a year for crude oil.
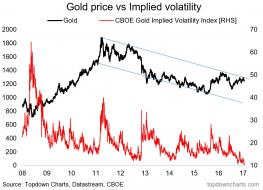
GOLDvol.jpg
Gold's volatility has fallen to the lowest level in half a decade. A big move is coming.
2

REALreturnFORECAST.jpg
equity returns to expect over next 10 years.
2

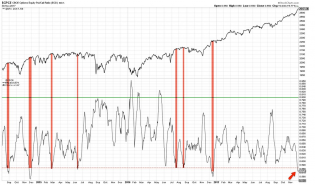
VIX2.jpg
Volatility Index: 7 out of top 20 lowest weekly closes have occurred in 2017. Most peaceful market in history. $VIX
1

FEDrecessioncasue.jpg
Goldman Finds Most Modern Recessions Were Caused By The Fed
2
VIX.jpg
New record in non-commercial VIX shorts
2

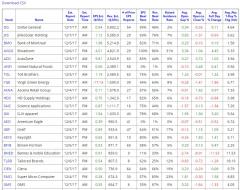
CDX.jpg
CDX HY 5 year CDS spread rounding bottom / falling wedge breakout

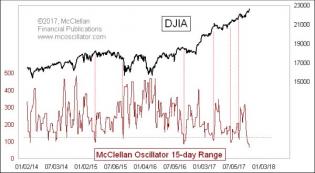
MovingAverages.jpg
The importance of moving averages
3
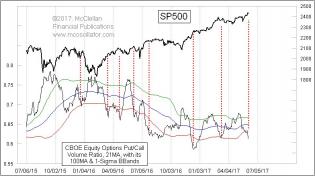
putcallratio.jpg
CBOE's Equity Put/Call Ratio 21MA is below its lower band, working without a net Q2 quad witch.

RUTTYvsNASTY.jpg
Here is every time in past decade when big-cap tech reached a new high and barely half of small-cap stocks were in...
1

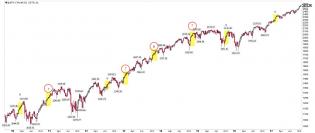
BearPorn87.jpg
1987-2018 analog

Housing.jpg
The Housing Moment Investors Dread Is Here

Debt.jpg
Household debt delinquency low, trend flattening. Uptick in delinquency leads cycle end (from Calculated Risk)

NewTraders.jpg
Not enough new traders see or understand this. It's everything....Manage risk like a father of four teen age daughters.
3

VWAP.jpg
VWAP corrective levels to watch

GS.jpg
Squid$230strikelock

Hedgefundnet10year.jpg
Hedge fund net longs in 10-year note futures rise to highest in nearly a decade....they were very correct last time.

CorrelationConcern.jpg
A Warning That the Biggest Risk for Markets Could Be Too Much Harmony

Q1-2017earnings.jpg
Q1 2017 earnings to date 5/5/2017

JAWbone2.jpg
FOMC jawboning at all time highs, yada yada yada

shitcoin.jpg
Bitcoin finally understands that Macron wins.
4

Shortinterestlowestsince 07.jpg
SPY short interest falls to the lowest level since 2007
1

DIVYcuts.jpg
76 US companies declared dividend cuts in March, increase of 41 firms fro...
1
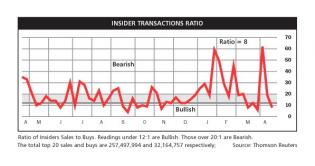
InsiderSell.jpg
Insider selling complete?
2

retail bankruptcy.jpg
Retail bankruptcy YTD 2017 exceed 2016

XRT....time to crush some shorts.jpg
XRT...time to crush shorts

The 10-day Open Arms Index is a modification by Peter Eliades of...
The 10-day Open Arms Index is a modification by Peter Eliades of Richard Arms' original idea. Current reading says...
3

Iron Ore $SPX....caution.jpg
Iron Ore $SPX....caution
1
VIX relative to VXV...ratio north of 1 = people are more worried...
VIX relative to VXV...ratio north of 1 = people are more worried now vs later...tend to = market bottoms
2

COMPQ.jpg
COMPQ
1

USDJPY.jpg
USA/JPY
2

RetailSalesConsecutiveMonthsofGain.jpg
Retail sales consecutive months of gain

Non store retail sales.jpg
Non Store Retailers

Consumers expecting to default, loans.jpg
Consumers expecting to default, loans
3

USgdpQuarter.jpg
US GDP quarterly
1
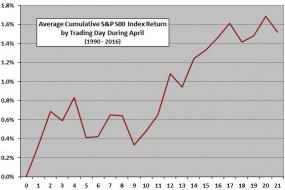
APRIL.jpg
Amend April seasonal forecast
1

SEVENyearreturn.jpg
Seven year GMO return forecat

Seasonalview.jpg
April seasonal history
2