View: $VIX$SPY.png
$VIX$SPY.png
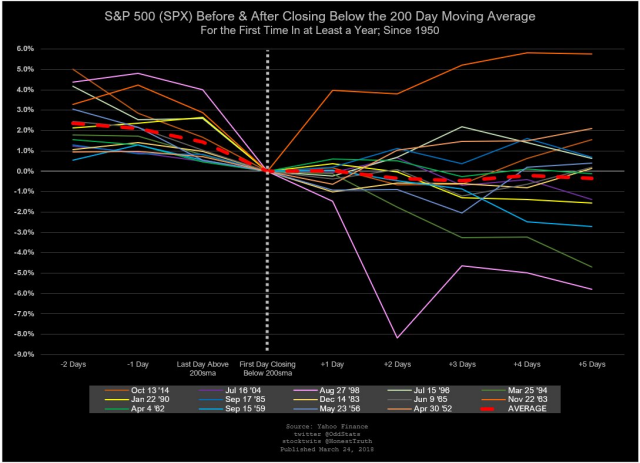
If $SPX closes this coming week below the 200sma, it will be the first time since Jun '16. But is that a short-term bearish signal? Here's a chart showing the 14x since 1950 that SPX closed below the 200d for the first time in at least a year.
The average draw down over the next 5 trading days was -2.4%, but only 3 of the events saw a draw down of more than -3%.
The average 5-day return was -0.3% but 8 of the 14 events were positive five days later. The average was skewed by 2 events ('98 -5.8% and '94 -4.7%).
The average draw down over the next 5 trading days was -2.4%, but only 3 of the events saw a draw down of more than -3%.
The average 5-day return was -0.3% but 8 of the 14 events were positive five days later. The average was skewed by 2 events ('98 -5.8% and '94 -4.7%). The average draw down over the next 5 trading days was -2.4%, but only 3 of the events saw a draw down of more than -3%. The average 5-day return was -0.3% but 8 of the 14 events were positive five days later. The average wa
 MississippiMan