Browse Stacks: Analytics: Momentum
slopechart_SPY.jpg

slopechart_RBRK.jpg

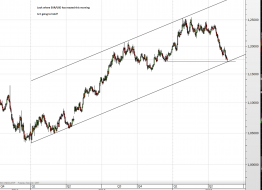
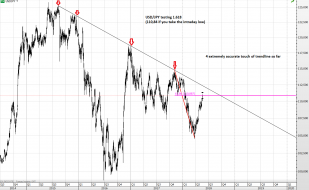
GBP_USD Mini_20250326_04.25.jpg
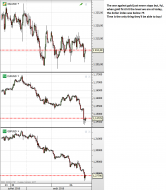
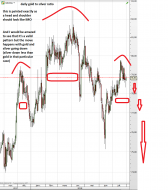
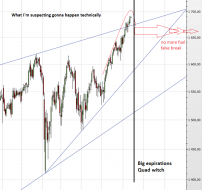
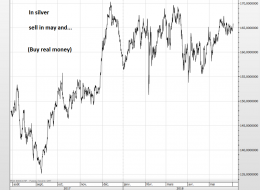
GBP/USD Mini short. So far so good! 45 minutes to go to fiscal armageddon.

1
slopechart_SPY.jpg
1
dgd.png
Top 10 market capitalization:
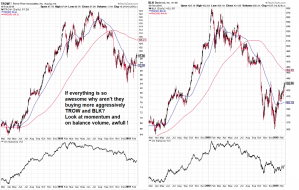
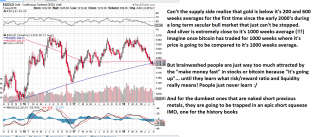
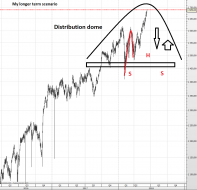
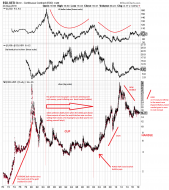
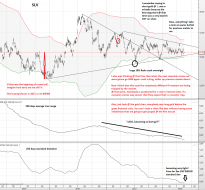
Looking more and more like distribution and a topping process to me
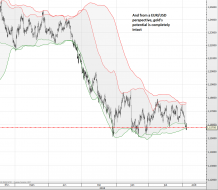
And 16T is s...

Capture d'écran 2024-01-22 033551.png
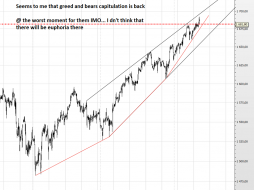
Some food for bears
slopechart_ADBE.jpg
short term strength

1JUN19.png
End of an era precursor?
slopechart_JOE.jpg
50/100 MA Cross. Seems a decent chart.

VIX.jpg
$VIX chart from FAIRLEAD STRATEGIES
https://www.marketwatch.com/story/wall-streets-fear-gauge-is-flashing-a-warnin...
slopechart_$BTC.jpg
My first go at technical analysis on a wide time horizon for Bitcoin. Fun trying to pick out different features, I...
2
slopechart_FSR.jpg
One of the weaker EV companies that is near tapping against right shoulder. Big gap to fill, early in the downtre...
slopechart_NTR.jpg
breaking out
slopechart_VNQ.jpg
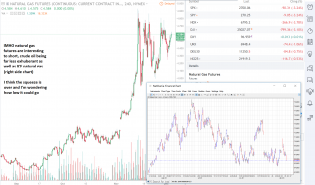
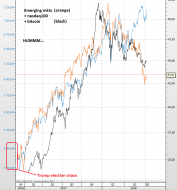
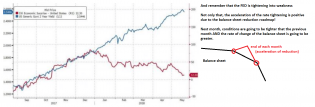
I drew 2 regression lines to try and see if the market was still in COVID recovery or if something else is now hap...

slopechart_JNJ.jpg
A solid perennial riding inflation up.
slopechart_FTNT.jpg
FTNT is on the way up. I think it's top dawg in the Cyber Security industry.
slopechart_NOK.jpg
Heh! NOK has 5 solidly beaten. Next big inflection point may be 5.80.
slopechart_VNQ.jpg
The Rent's Too Damn High! At least compared to the regression line I previously drove through this one.
slopechart_CAR.jpg
CAR could be running out of gas. GS and Blackrock believe this to be the case and have dumped it.
2
slopechart_EPD.jpg
Looks about to go sideways and out of a positive channel.
slopechart_ACB.jpg
cup and handle ACB stack

1
slopechart_BLNK.jpg
Can it hold the 21 EMA, or is it gonna blink?
slopechart_ACTG.jpg
opposite of Tim's terminal wedge post , I bought the break and have rewarded nicely .
slopechart_FDX.jpg
34 EMA holding since 5/26
slopechart_SBSW.jpg
slopechart_GME.jpg
short squeeze
2
try.jpg
Weekly log chart of USD/TRY showing a cup and handle formation. Turkey's central bank has thrown most of its forei...
2
slopechart_AMZN.jpg
AMZN last 5 trading days:
down 7.4% Friday close to next Friday close
down 12.7% Monday high to Friday low

file
1
slopechart_WBA.jpg
Vitamin C for me with 1 minute matching VWAP.

1
Above Average! – Slope of Hope
Sometimes I use Arithmetic instead of Mathematics
2 feb21.PNG
1
1 feb21.PNG
US-auto-loan-deliquencies-dollars-2019-Q4.png
US Auto Loan Delinquincies
slopechart_CRWD.jpg
breaking out
1
slopechart_KBAL.jpg

migration.jpg
Interesting map.
1
slopechart_CVM.jpg
3
2 nov19.PNG
1
bandwidth.png
They can't track you when you're using all the bandwidth. :)))))

cocoa.jpg
Cocoa futures volume looking bullish. However, seasonality says that it will not end higher in May. Find it hard t...

weekly.jpg
Here's a UK smaller companies fund. Looks it will go higher no matter what the final result of Brexit is. And yes,...

weekly.jpg
Breakout of UK index linked gilts less than 1.5 weeks to Brexit deadline. Had assumed that there would be a breako...
4 feb17.PNG

ob.jpg
Stocks reach 2nd most overbought level on record. Chart from https://realinvestmentadvice.com/fed-kills-the-bear-for-...
2 dec5.PNG
1 dec5.PNG
s3.amazonaws.com/cdn2.soci..._XX0STy_l.png
Thanks MS. Man
"R., in an amazing turn of events, Kyrsten Sinema may still win her US Senate race in Arizona fo...

4

3 nov9.PNG
1 aug31.png
2 aug20.png
1
1 aug19.png
3 aug17.png
10 aug16.png
5 aug16.png
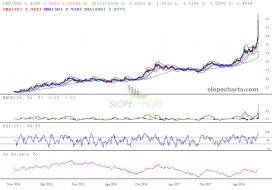
slopechart_USD/TRY.jpg
Yowza!
7
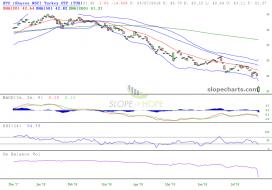
slopechart_TUR.jpg
Oh my! Ouch!
1
1 aug10.PNG
5 aug8.PNG

1 aug8.PNG
2
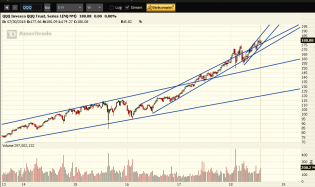
s3.amazonaws.com/cdn2.soci..._rroLVb_l.png
QQQ roadmap. SPY has similar sequence of steepening channels.
1
2 aug3.PNG
1 aug3.PNG
7 aug1.PNG
2
3 aug1.PNG
5 july20.PNG
3 july20.PNG
1
2 july20.PNG
1 july6.PNG
2018-06-19_10-55-03.jpg (890×450)
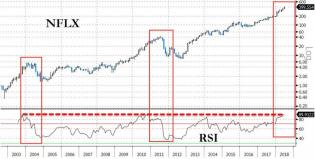
$NFLX most overbought levels in history.

3

5 june15.PNG
2 june15.PNG
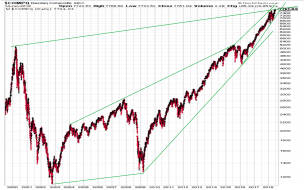
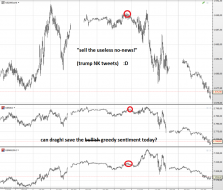
Nasdaq composite in long term parabola
sustainable?
4 june14.PNG
1 june14.PNG
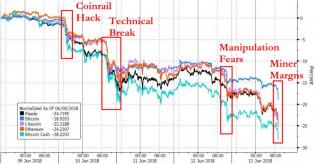
Crypto Collapse Accelerates As Bitcoin Miners Turn Cashflow Nega...
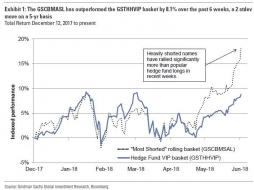
Goldman: The Past Month Has Been One Giant Short Squeeze; Here's...
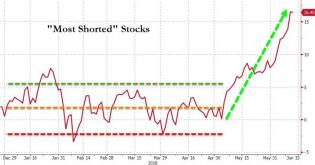
Goldman: The Past Month Has Been One Giant Short Squeeze; Here's...
1
6 june13.PNG
4 june13.PNG
2 june13.PNG
6 june12.PNG
2
5 june12.PNG
2 june12.PNG
2 june11.PNG
1 june2.PNG
1
3 june1.PNG
2 june1.PNG
3 may30.PNG
1 may25.PNG
2 may24.PNG
2
8 may23,.PNG
2 may23.PNG
4 may21.PNG
3 may21.PNG
2 may21.PNG
13 may18.PNG
12 may18.PNG
5 may18,.PNG
4 may18,.PNG
12 may17.PNG