Users: zu5aea72d2d45dc: All Pages
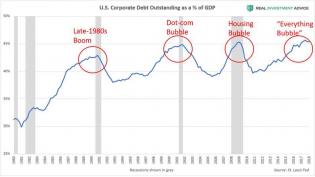
Corporate Debt vs. GDP
Total outstanding nonfinancial U.S. corporate debt surged by over $2.5 trillion, or 40% from its peak in 2008. The...

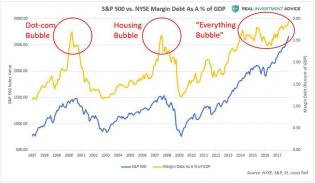
SP500 vs. Margin Debt As % of GDP
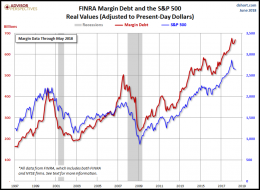
Forbes " During the dot-com bubble and housing bubble stock market cycles, margin debt peaked at roughly 2.75% of...
DlHHM5CU4AAm0Q_.jpg (540×348)
When's the party over?
1
Imgur: The magic of the Internet
As Fed continues with rate hikes, the yield curve continues to flatten. Spreads on 10-2y reach lowest point of t...
Imgur: The magic of the Internet
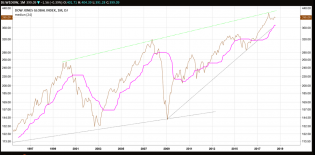
DJ Global Index with 2 year median. Globally market valuations have not recovered to previous highs. Global equi...
Imgur: The magic of the Internet
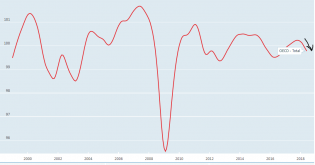
The OECD composite leading indicator (CLI) is designed to provide early signals of turning points in business cyc...
Imgur: The magic of the Internet
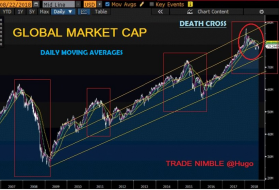
Death X marks the trend in global market cap
Imgur: The magic of the Internet
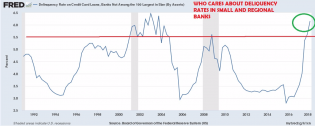
Delinquency rates on credit card loans ... nothing to see here... move along please...
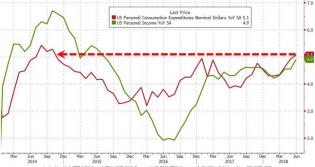
2018-07-31_5-43-31.jpg (890×472)
Americans spending outpaced their income for the 5th month in a row
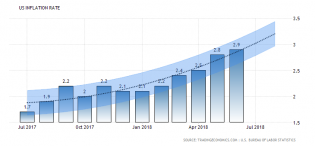
United States Inflation Rate
Inflation rate nearing 3% ... the fastest rates of inflation for over six years. The market may be underestimatin...
1
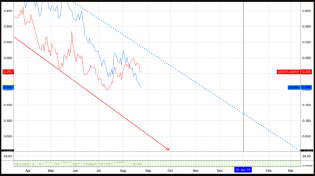
nVA8Dfue (1243×704)
Calm before the storm: 10-year Treasury yield in the smallest weekly trading range since before 1980.
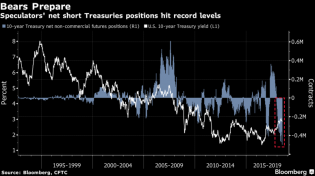
Treasury Short Bets May Be on Borrowed Time - Bloomberg
hedge-fund managers and large speculators
boost 10-year note short positions to a record levels
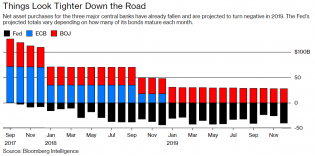
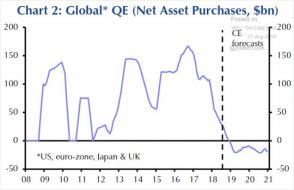
s5jV4r4.png (1051×523)
Central bank purchases are shrinking and projected to turn negative by 2019. QT is considered by many fund mana...
1
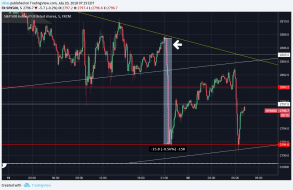
87N7Y5HE (1087×704)
Markets jolted last night by another mini 'flash crash' with /ES plunging more than a half percent in minutes....
3
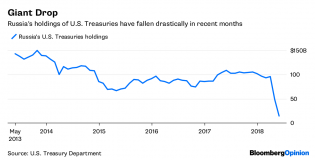
Moscow Mystery: Where Did All Its Treasuries Go? - Bloomberg Quint
Treasury reported that Russia is no longer a “major foreign holder” of U.S. government securities after dumpin...
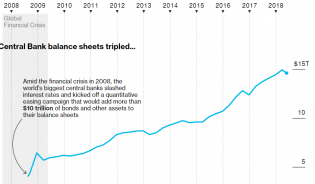
Nzgav8o.png (932×547)
Central bank balance sheets have tripled since the global financial crisis a decade ago.
1
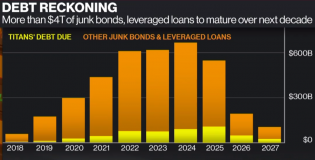
ajatCiR.png (1115×567)
Debt Reckoning: More than 4T of junk bonds to mature over next decade.
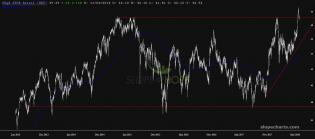
Blinking Red Bubble Light: Stock Market Investor Margin Debt Rea...
Margin debt & S&P500
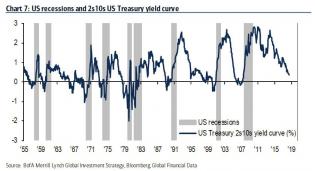
BofA's "Charts Of Darkness" | Zero Hedge
2-10y T yield spread and recessions
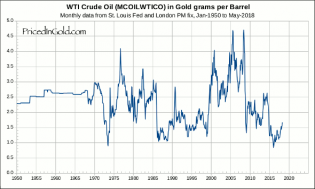
Crude Oil
clearly showing the relationship of the gold price to the energy costs for mining it out of the ground
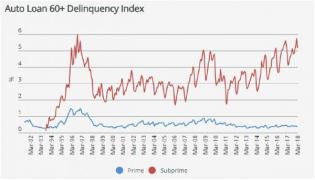
auto loan delinquencies subprime auto loans
subprime auto loan defaults are above Great Recession levels and rising
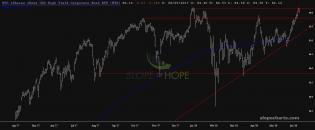
slopechart_HYG.jpg
Risk on rally in junk for June! HYG currently pays a 30 day yield of 5.76% on fund holdings rated BB grade and und...
2
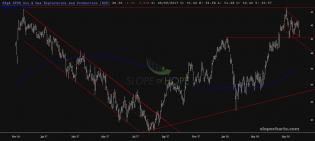
slopechart_XOP.jpg
OPEC plans to increase production in the 2nd half of this year. E&P companies topping out here ? Watching for fa...
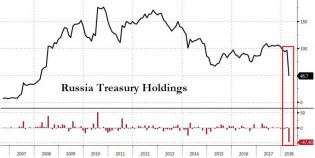
Here Is The Stunning Reason Why Treasury Yields Blew Out In Apri...
In April, Russia liquidated $47.4 billion, half of its US Treasuries, , its lowest holdings since March 2008. Th...
2
slopechart_XRT.jpg
Retail bankruptcies hit an all-time high in the first quarter of 2018, with nearly a dozen prominent U.S. chains f...
2
6xmnGLc1 (1444×703)
Tug-o-war : SPX vs Fed unwinding the balance sheet.
1
PC7dKU2.png (1564×940)
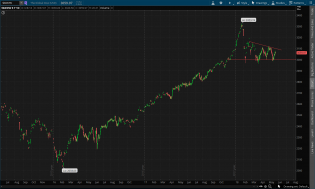
$GDOW : slowing global growth story ahead? Set alerts for fail of 3000 support !
zI9TDgZE (1440×701)
Chart showing the flattening Treasury yield spreads of the 10-2 and 30-5. At this rate the curve could flatten...
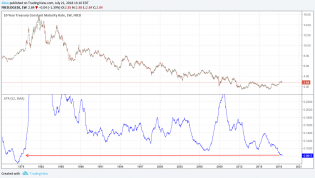
MBy5dqWF (1148×701)
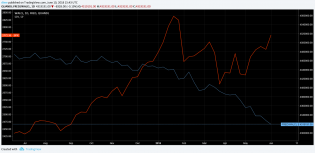
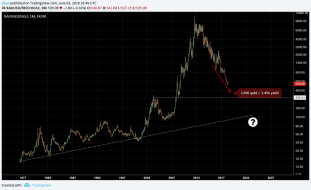
This log chart compares the Gold price (USD) to the short term 2 year Treasury yield. Since gold has no yield is i...
1
9yQCN5yB (1148×701)
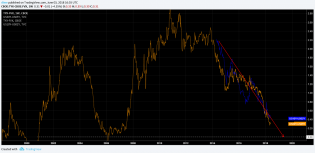
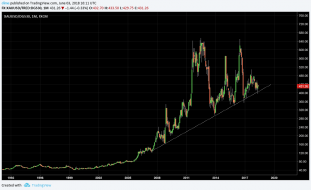
ratio of Gold price to 30 year Treasury yield