View: MBy5dqWF (1148×701)
MBy5dqWF (1148×701)
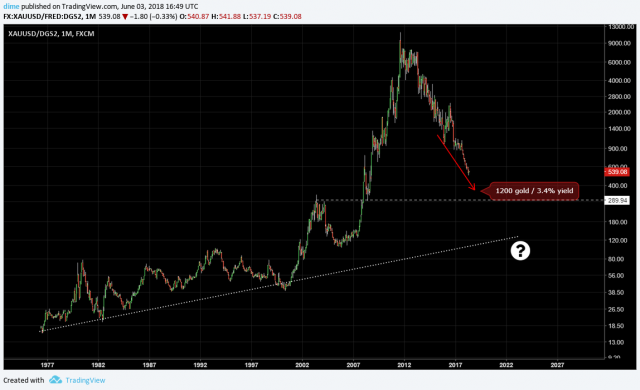
This log chart compares the Gold price (USD) to the short term 2 year Treasury yield. Since gold has no yield is it possible it will continue to sell off as 'risk free' treasury yields rise? Some analysts expect the Fed to hike three more times this year and four times in 2019, bringing the terminal fed funds rate to 3.4%. Could potentially the yield curve may flatten in the coming year giving a 2 year yield of approx 3.4%, and gold drop to 1200, printing a ratio of 353 this chart? What are your thoughts?
Comments
...

That's not that simple :)
What you should ask yourself when trading any market is: from my scenario, what is the information that is already priced in the market today?
For example, my personal opinion on what you've written about rates, I consider it to be already in today's price (@ least a big part of it) so if I'm right there is an asymetric situation (caused by the high consensus) that is:
More hawkish expectations coming from now= small downside impact in the price of gold
More dovish expectations coming from now= much higher upside impact in the price of gold
Same as during an earning results season, when the stock market is in a raging bull mode and is historically expensive :
Good numbers come out: stocks of the company flat or up modestly
bad numbers (or just a bit below consensus expectations): stocks of the company gets punished hard!
Also remember that standard aren't the same nature when you divide a dollar price by a yield.
Interest rates basis points are a "constant" metric throughout time
Paper dollars aren't
So, for example, an horizontal line is less relevant in such a chart (in today's economic system) IMHO 6/4/18