I need see China money supply growth rate be declining to be sure that sizable stockmarket decline is coming... i don't see it yet. (I think China credit expansion is source of world economic stability of this year)
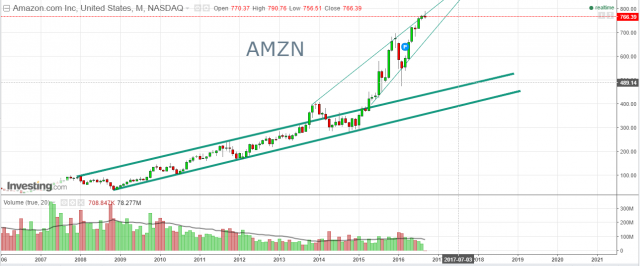
because if you look at a chart of AMZN since introduction you would think that thos stock performed only the last few years but it's really not the case. For example the best time to have bought AMZN was between 1997 and 1999 (price multiplied by more than 50!!!)
And on a linear chart you would think this period was a small rise so, IMO, technical analysis on a linear chart doesn't mean what people generally think when they are using it (I'm not saying that it's useless) 9/14/16
AMZN has traded in canal few years which has been broken up only last year. The chart looks like spike and rising wedge. I guess the test of upper line of canal is coming. This is what i want to show. If I'd want to show best time to buy then i'd have posted LOG chart. I thought this is obvious. 9/14/16
 Silver Singularity

