User: Dimon

All Pages Stacked
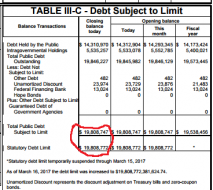
20170514_DebtLimit.png
Debt limit hit the ceiling. That means reduced Treasury supply until the debt ceiling is raised. That is bullish f...

1
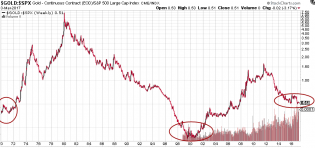
20170305_GOLD2SPX.png
GOLD to SPX. there is some similarity
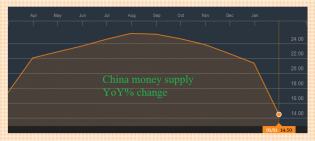
20170221_ChinaM1YoY.png
M1* YoY% change has extended decline in January. China economy is going to burst.
*M1 is most approapriate to m...
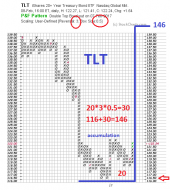
20170209_tlt.png
TLT in accumulation.
9

20170203_copper.png
Monthly breakout. Now in backtesting.
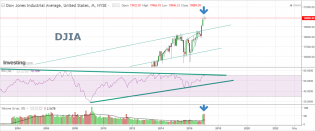
20170202_DJIA_dodji.png
dodji candle with high volume on monthly chart of DJIA
4
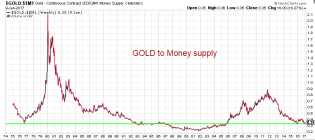
20170121_GOLD_2_M1.png
Gold is cheap, but not as cheap as of 2001
1
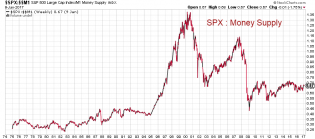
20170121_SPX_2_M1.png
not as overbought as last 2 times. Sizeable correction is possible not crash
7
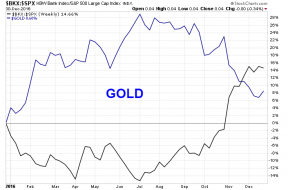
20170101_GOLD.png
Fundamentals still looks bearish for gold. This rally must be sold.
7
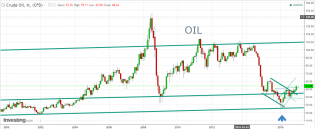
20170101_oil.png
wedge breakout on monthly chart
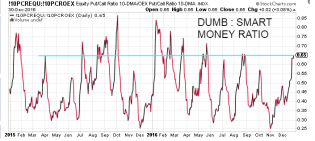
20170101_DumbToSmart.png
Dumb to smart money is about to generate bullish signal
5
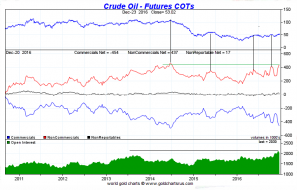
20161224_oil_cot.png
Market is too optimistic. Sizeable downside correction is very likely in coming months.
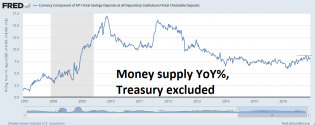
20161223_US_MoneySupply_2.png
Austrian school of economics true money supply for USA (Treasury account excluded).
Looks like money supply gro...
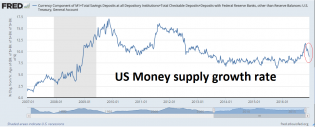
20161223_US_MoneySupply.png
Austrian school of economics true money supply for USA (Treasury account included).
Very interesting developmen...
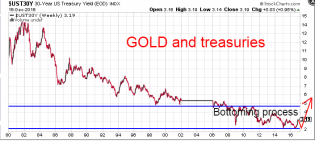
20161217_UST30Y.png
As Austrian school of economis says the main reason for boom/burst circle is credit expansion/contraction. Recent...