Users: Dimon: All Pages
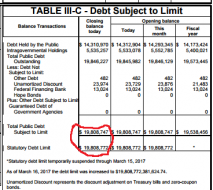
20170514_DebtLimit.png
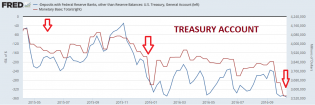
Debt limit hit the ceiling. That means reduced Treasury supply until the debt ceiling is raised. That is bullish f...

1
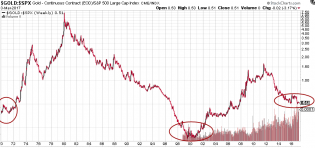
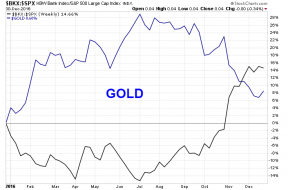
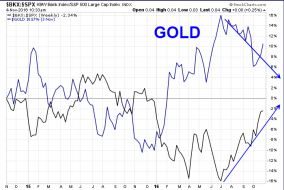
20170305_GOLD2SPX.png
GOLD to SPX. there is some similarity
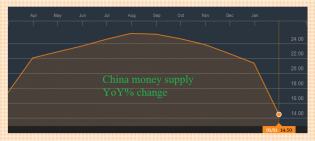
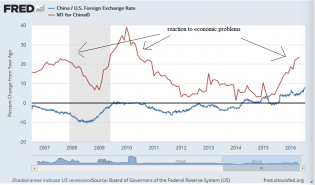
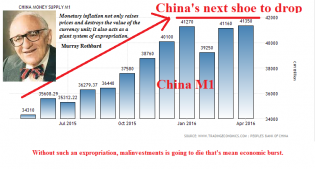
20170221_ChinaM1YoY.png
M1* YoY% change has extended decline in January. China economy is going to burst.
*M1 is most approapriate to m...
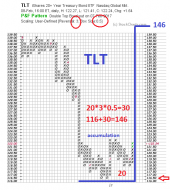
20170209_tlt.png
TLT in accumulation.
9

20170203_copper.png
Monthly breakout. Now in backtesting.
20170202_DJIA_dodji.png
dodji candle with high volume on monthly chart of DJIA
4
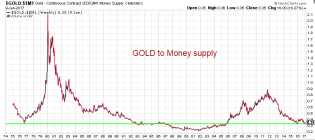
20170121_GOLD_2_M1.png
Gold is cheap, but not as cheap as of 2001
1
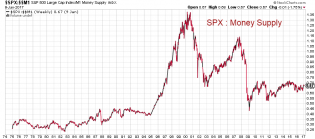
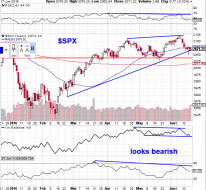
20170121_SPX_2_M1.png
not as overbought as last 2 times. Sizeable correction is possible not crash
7
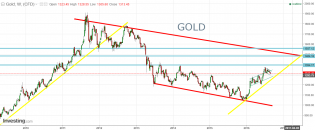
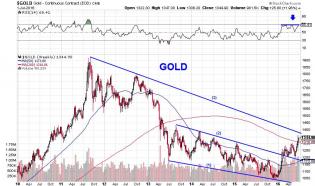
20170101_GOLD.png
Fundamentals still looks bearish for gold. This rally must be sold.
7
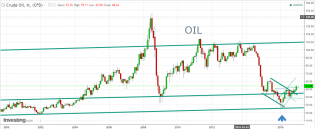
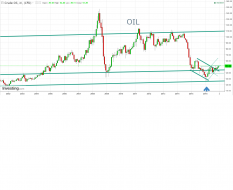
20170101_oil.png
wedge breakout on monthly chart
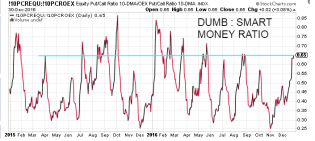
20170101_DumbToSmart.png
Dumb to smart money is about to generate bullish signal
5
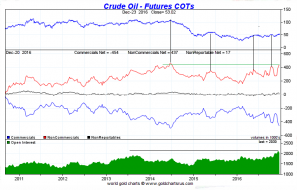
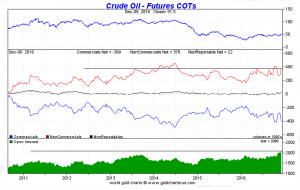
20161224_oil_cot.png
Market is too optimistic. Sizeable downside correction is very likely in coming months.
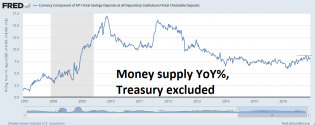
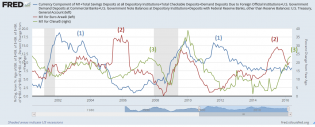
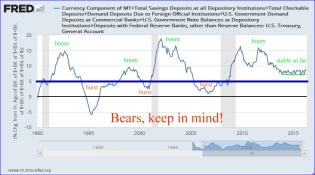
20161223_US_MoneySupply_2.png
Austrian school of economics true money supply for USA (Treasury account excluded).
Looks like money supply gro...
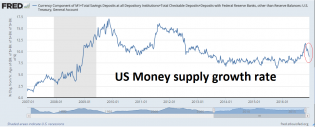
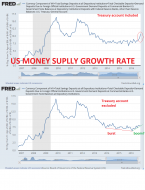
20161223_US_MoneySupply.png
Austrian school of economics true money supply for USA (Treasury account included).
Very interesting developmen...
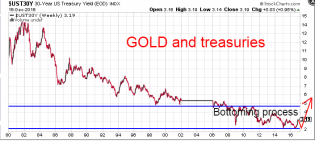
20161217_UST30Y.png
As Austrian school of economis says the main reason for boom/burst circle is credit expansion/contraction. Recent...
20161210_OIL_COT.png
money flow to oil futures market
2
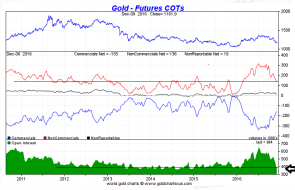
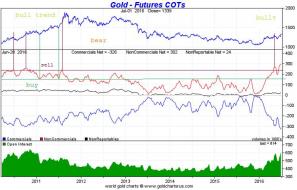
20161210_GOLD_COT.png
GOLD COT. looks like most speculators have gone.
20161210_DJA.png
bull shit

20161210_Copper.png
20161210_oil.png
still in wedge
20161210_MoneySupplyUS_Treasury.png
Austrian school of economic true-money-supply growth rate. Do you anticipate more QE from the FED? I guees new mon...
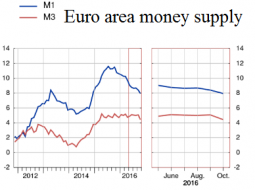
20161128_EuroAreaMoneySupply.png
M1 is steady declining. This is not going to end well. More troubles is ahead for Europe
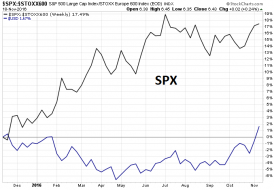
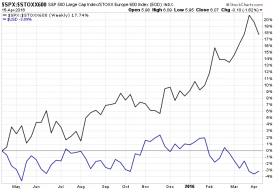
20161120_SPX_STOXX_USD.png
someone is wrong. may be USD must go down, may be SPX must go down or STOXX600 must go up
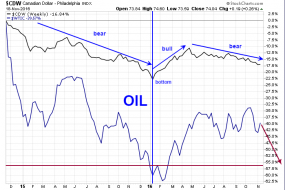
20161120_WTIC.png
looks bearish for oil
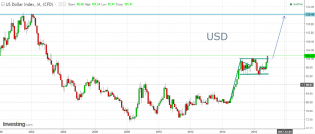
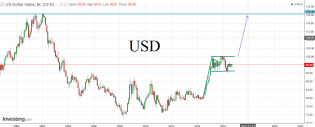
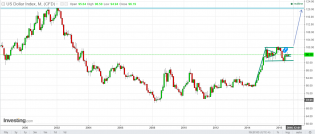
20161120_USD.png
"I TOLD YOU SO" moment :)
3
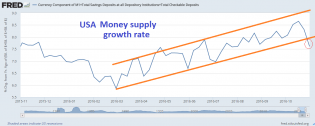
20161112_MoneySupply.png
Trend change?
20161104_GOLD.png
looks bearish for gold
1
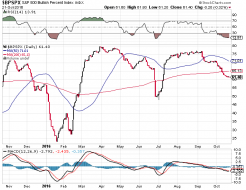
20161023_BPSPX.png
SPX looks weak
3
20161023_TreasuryAccount.png
$59 billion surge during last week. Treasury aggressively raise cash level. Why? There is answer. Quote from TBAC...
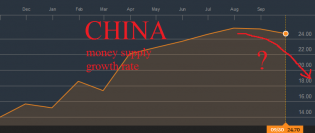
20161019_ChinaYoY.png
Chinese money supply growth rate has started to decline. It may cause economic burst around the world.
2
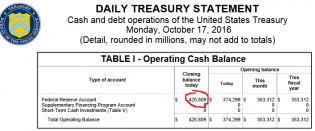
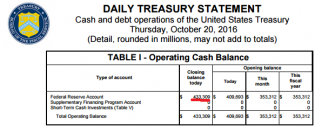
20161019_Treasury.png
General treasury account. $420 billion!!! Very, very dangeries level. Are they accomulating cash for risk management...
2
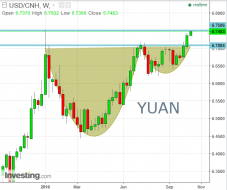
20161017_YUAN.png
OMG! This is bearish for commodities.
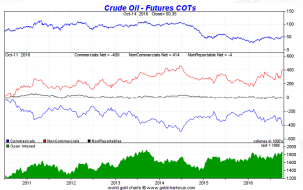
20161016_OIL_COT.png
speculator's long positions is in highest level from 2014. Looks bearish.
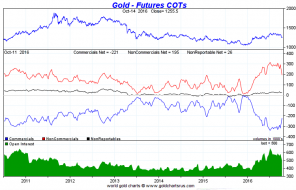
20161016_GOLD_COT.png
COT has drop to May level.
20161015_MonetaryBase.png
Treasury account has increased to danger level. If they don't give this money back to market soon then some stock...
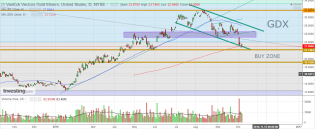
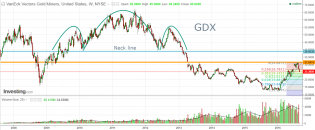
20161008_GDX.png
waiting to buy for long term investment
3
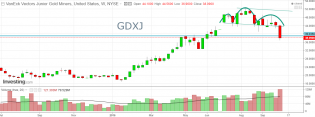
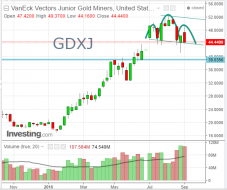
20161008_GDXJ.png
Good oportunity to buy is coming soon
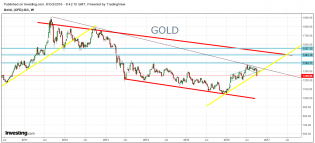
20161008_GOLD.png
I guess correction is not over
1
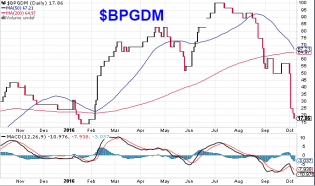
20161008_BPGDM.png
nice correction
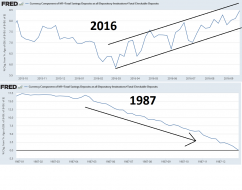
20161001_MoneySupply.png
Still waiting stock market crash? Money supply growth rate looks bullish so far this year.
3
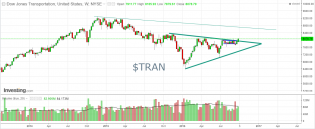
20161001_TRAN.png
bulls have a ball
2
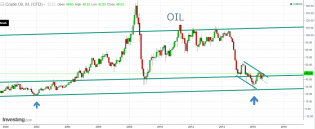
20161001_OIL.png
OIL has broken resistance. Test of this year minimum is not on radar now.
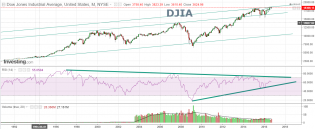
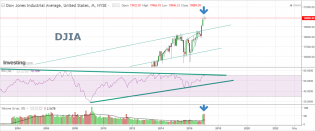
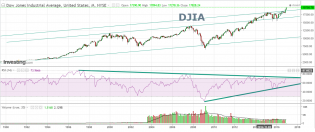
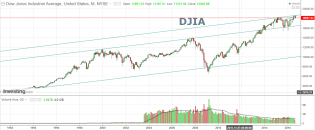
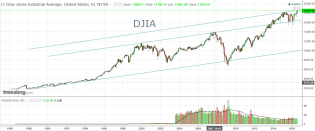
20161001_DJIA.png
Still in wedge
1
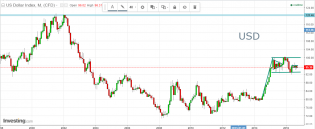
20161001_USD.png
USD is still in 2 bull flags. Still looks bullish.
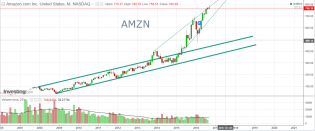
20160914_AMZN.png
I need see China money supply growth rate be declining to be sure that sizable stockmarket decline is coming... i...
4
20160911_GDXJ.png
week has closed at support
20160910_DJIA.png
Wedge has been broken down, but this is monthly chart, mean nothing yet untill month ends.
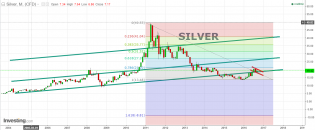
20160909_silver.png
Silver, Monthly. Price is in red bull flag. 21.20 is a key resistance.
2
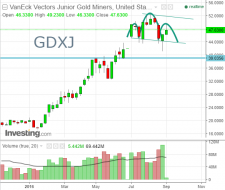
20160907_GDXJ.png
H&S?
3
200160901_gold.png
still looks bullish
20160901_GDX.png
looks like GDX is going to 24.14 (0.382 fib level)
20160901_usd.png
still in little and big bull flags
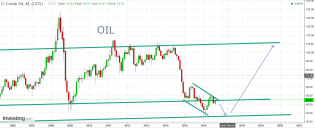
20160901_oil.png
august ended at resistance, it make possibility of this year bottom test a little more likely in next 6 - 8 months
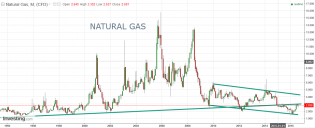
200160831_naturalgas.png
NG is testing broken long run support line

200160831_copper.png
I guess copper is in bottoming process, but may be it is bear flag.
200160830_DJIA.png
testing resistance. where month ends?
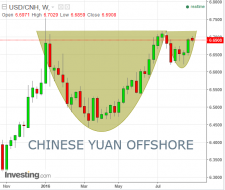
20160830_usdcnh.png
Looks bullish for usdcnh. That is bearish for commodities.
3
20160825_gdx.png
Support line is broken. Looks like correction has started. Good opportunity to buy is coming.
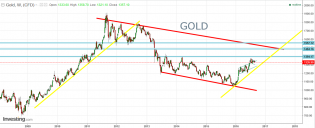
20160825_gold.png
Looks bullish. Gold is going to test red line resistance in coming months.
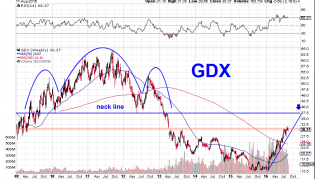
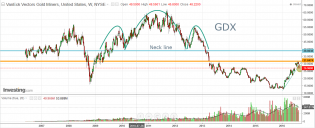
20160818_GDX.png
looks like GDX is going to test neck line
1
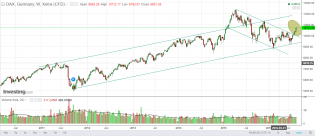
20160815_DAX.png
Bulls Still Have The Ball
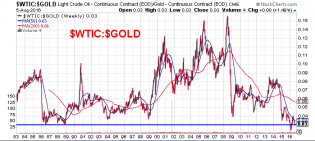
20160806_WTIC_GOLD.png
sell some gold buy some oil
2
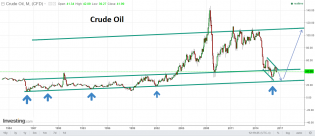
20160806_CrudeOil.png
4
20160806_dx_monthly.png
still in a little bull flag and in a big bull flag
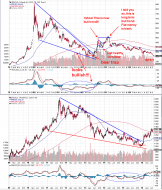
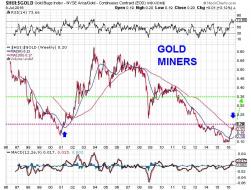
20160730_2golds.png
I don't say gold is not in bull market. Just keep in mind there is bear case. The difference between now and 1982...
15
20160730_DX.png
oops
20160730_USA_EURO_CHINA.png
USA, Euro area, China money supply growth rate. They stimulate one by one. The next economic burst will happen wh...
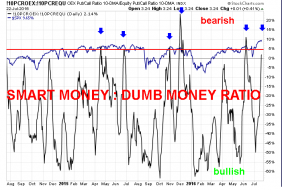
20160723_SmartToDumbRatio.png
Smart money to dumb money ratio is about to generate short term bearish signal
4
200160722_usdcny_m1china.png
Chinese money supply growth rate is running to up. I think this is one of major reasons of commodity rally of this...
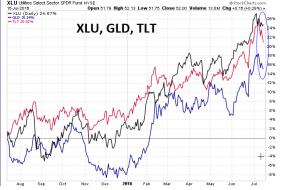
20160717_XLU_GLD_TLT.png
Great trio has changed their course
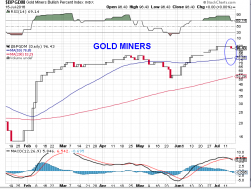
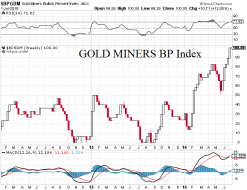
20160716_BPGDM.png
correction is started
2
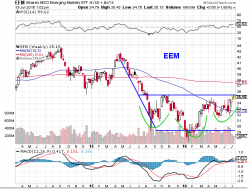
20160713EEM.png
bear flag vs. bull inverse H&S. Who will win?
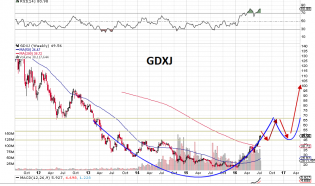
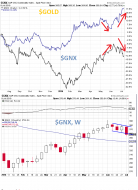
20160713GDXJ.png
possible way
5
20160709_HUI_GOLD.jpg
long way ahead
20160709_SPX_DJIA_IWM_NDX.png
Bears still have a chance
1
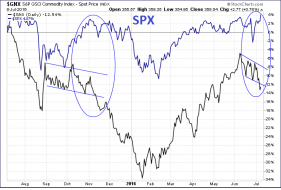
20160709_SPX_GNX.png
Bears still have a chance
20160709_GOLD_GNX.png
I don't say gold can't go higher. But there is something to worry about.
BPGDM.png
from 0 to 100%. Time to take some money off the table
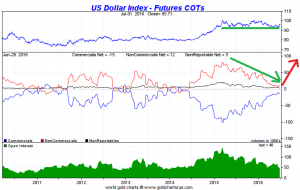
USD_COT.png
Sizeble decline in longs without real damage for USD. Looks bullish. (free chart from sharelynx.com)
2
GOLD_COT.jpg
This is free chart from www.sharelynx.com
It represent COT data for GOLD.
IF gold is in bull trend then horizont...
2
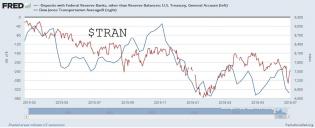
TRAN_TREASURY.jpg
As I recently said there is correlation between $SPX and inverted Treasury account (someone sell stocks to pay Tax...
GOLD20160702.jpg
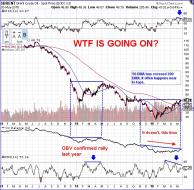
Looks like Gold have done false start this year. Too many opened long positions by short term speculators acording...
8
spx_20_06_2016.png
June 20, 21, 22 is a days of big treasury auctions. It might hit market again like auctions of June 7, 8, 9 did. T...
1
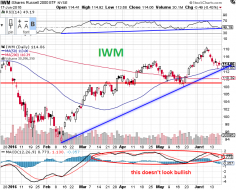
iwm_19_06_2016.png
June 20, 21, 22 is a days of big treasury auctions. It might hit market again like auctions of June 7, 8, 9 did....
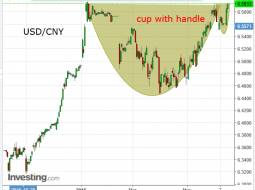
usdcny.png
4
m1_china.png
I guess China's money supply growth rate has been significant driver of commodity demand recent months. Looks like...
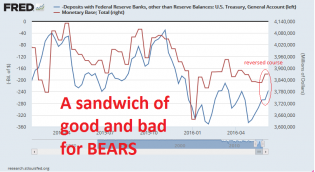
Treasury.png
I have studied Treasury financing schedule (debt issuance and redemtion) which is available at treasury.gov. Q2 wa...
2
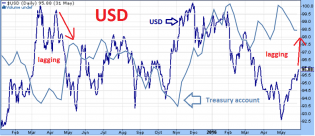
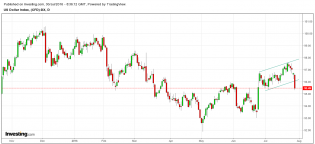
USD_INDEX.png
There is correlation between USD Index and Treasury account. To buy t-bills, t-notes or t-bonds one must buy US do...
3
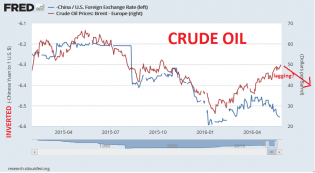
CRUDEOIL_YUAN.png
There is correlation between CNYUSD and Crude Oil. As I said in previous post CNYUSD correlate with Treasury Accou...
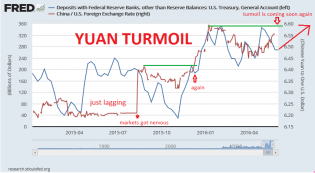
YUAN_AND_US_MARKETS.png
There is correlation between USDCNY and U.S. Treasury Account. Every time Treasury issue new debt (t-bills, t-note...
2
TRAN_SP500_MonetaryBase_Treasury.jpg
Recently I said that Monetary base is acting as leading indicator for Stock Market Indexes. Now I found that there...
2
TMS2.jpg
This is chart of growth rate of TRUE MONEY SUPPLY (TMS, austrian school of economics). Money supply growth change...
1
BRENT.jpg
very suspicious rally
1
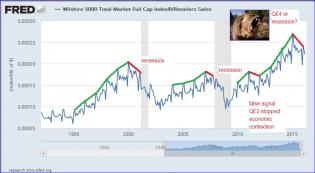
W5000_RetailSales.jpg
Wilshire5000 / Retail sales. Monetary Easy is coming. Gold miner's stocks correction will be excelent apportunity...
6
MonetaryBase_TRAN.jpg
Carnage is coming back this summer.
1
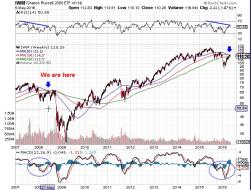
iwm_weekly_2008_analog.jpg
I am short on iwm
3
USD_rally_coming.png
100 week MA tag then rebound is coming
6
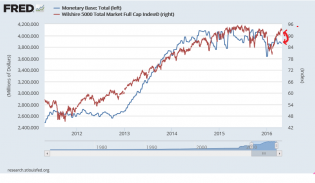
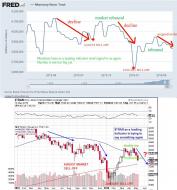
MonetaryBase_leading_indicator.png
Monetary base is a leading indicator. It doesn't confirm recent rally yet.
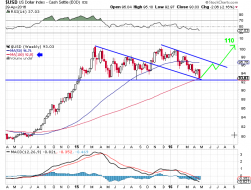
USD_Rally_ahead.png
USD rally ahead?
1
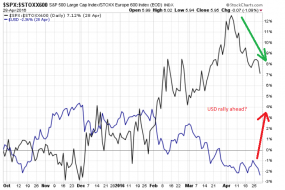
SPX_STOXX600_USD_Correlation.png
Does anybody have idea why $SPX:$STOXX600 and $USD has correlation?
5