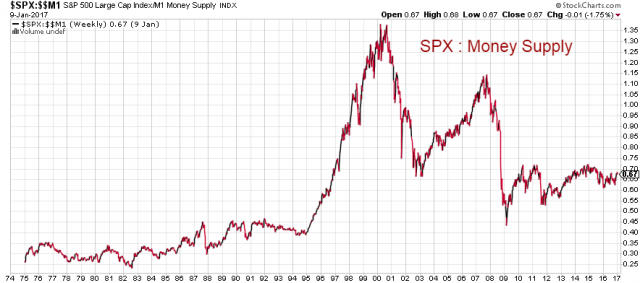
Interesting chart, but I think it shows that we have really boxed ourselves in, the Fed, that is. It just takes ever more money printed to achieve a marginal effect in the economy or markets. If there really are no more worries of deflation, then perhaps we are much, much further from market ATH's than we realize? 1/21/17
I think this way: prices on all actives is driven by monetary inflation. Some actives become high of mean (long term overbought), some become deep below mean (long term oversold). On investing purposes one must buy oversold actives and sell it on overbought levels. Last 2 times public has been too optimistic, they bid price to overbought level. This time public is not as optimistic as last 2 times. 1/21/17
But keep in mind velocity of money is useless. Velocity of money is calculated using simple formula Velocity = GDP / Money Supply. It is low only because of rapid rise of money supply recent years. It doesn't make sense to compare SPX and Velocity. 1/22/17
 Pipe&Snipes takeitallnight