Users: Mike1981: All Pages
tlt.png
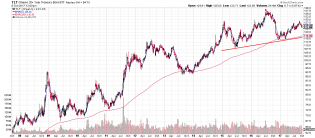
Possible Head Shoulders with TLT bonds.

hrs.png
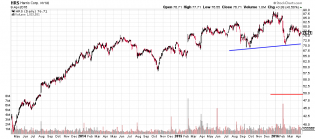
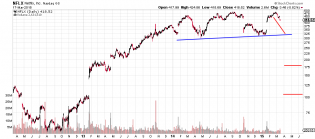
HRS: Head Shoulders Top.
NG.png
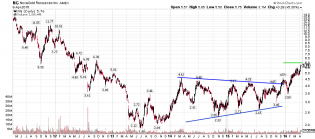
NG: Symmetrical Triangle. Finally making it's push and with in nickles of target.
1
afg.png
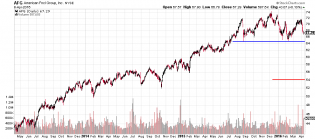
AFG: Head Shoulders Top.
bip.png
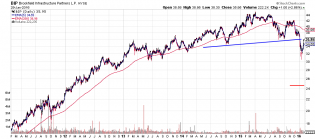
BIP: Head Shoulders Top. Target $25.00 incase you missed it the first time the stock is back testing pretty well.
2
asml.png
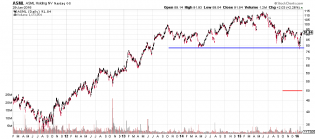
ASML: Head Shoulders Top target of $30.00.
2
Q.png
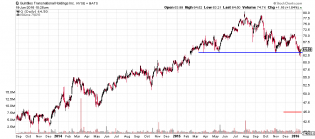
Q: Head Shoulders Top. Target is about $20.00 lower.
1
orcl.png
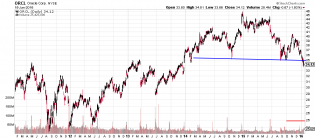
ORCL: Head Shoulders Top. 10 Point drop from here coming.
6
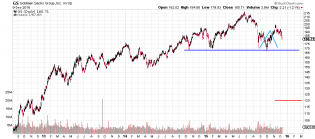
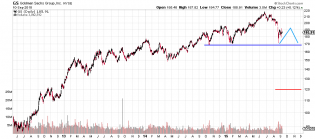
GS.png
GS: Goldman update. A little more downside will trigger a big sell off.
3
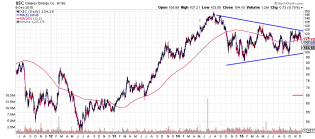
xec.png
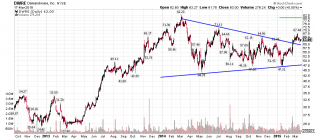
XEC: Symmetrical Triangle. Looking for support to be taken out and short position will trigger at about 96.00 with...
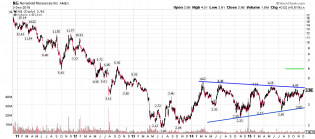
NG.png
NG: Symmetrical Triangle ready for break out. Target is $6.00.
3
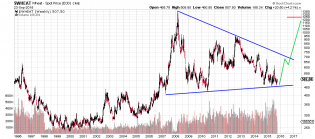
wheat.png
Wheat long term chart is a symmetrical triangle. If this is true then much higher prices are in store for this com...
gs.png
GS: A young head shoulders top building the right shoulder at the moment. Target $120.00
1
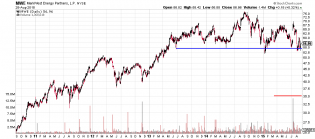
mwe.png
MWE: Head Shoulders Top. Target $35.00.
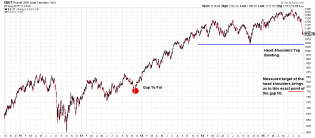
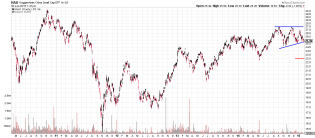
rut.png
$RUT: Food for thought. Gap to fill with a perfect measured target if the pattern which is building. Right shoulde...
2
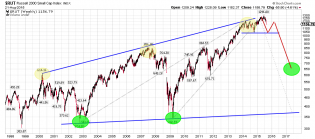
Rut.png
$Rut: Russell. I have been watching this play out all year. I think it is very reasonable that price action forms...
1
NG.png
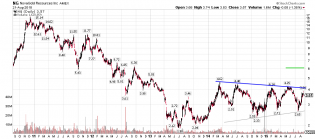
NG: Nice resistance line here. A break of this line will give about a two dollar rally. Bottom triangle here.
LSG.png
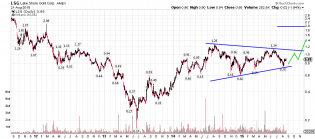
LSG: Symmetrical Triangle. Still young this pattern is keep and eye on it.
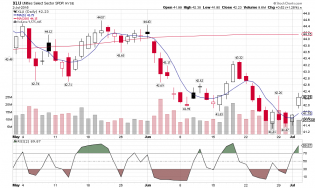
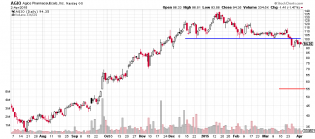
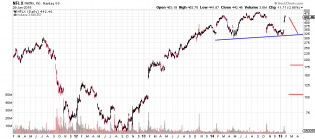
ANTM.png
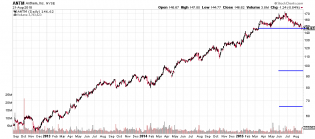
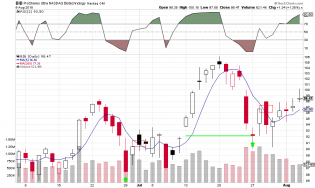
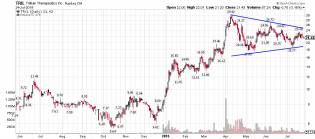
ANTM: Head Shoulders Top
aapl.png
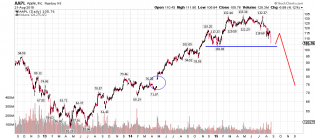
AAPL: Possible head shoulders top forming on apple sauce. Nice gap to fill below for the measured target.
alny.png
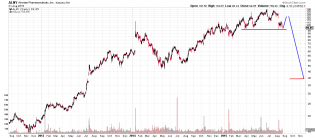
ALNY: Head Shoulders Top building right shoulder and should fill gap to top out the right shoulder.
1
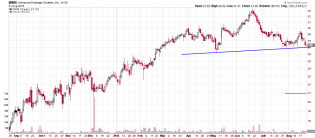
wms.png
WMS: Head Shoulders Top
1
mtsi.png
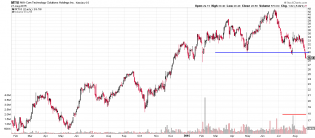
MTSI: Head Shoulders Top
flir.png
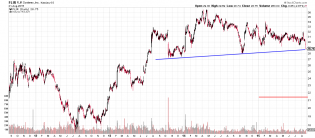
Flir: Head Shoulders top.
psa.png
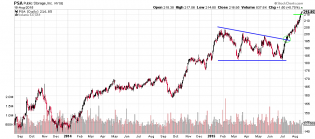
PSA: update. Price hitting target from the break out at 197.00 gotta love triangle patterns.
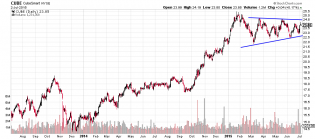
cube.png
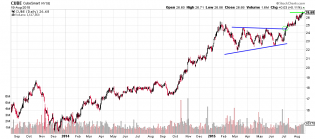
CUBE: Update from when I first posted this in June. Finally hitting target. Symmetrical triangle. Price broke out...
HLF.png
HLF: Head Shoulders Top. Someone send my chart to Ackman. Now's the time to short if I have ever seen it for this...
6
utilities.png
Utilities: This year the index topped out and now it's breaking down from it's long run. Target is 150.00 support.
1
Bib.png
BIB: Follow up for social trade from the other day using the RSI2 set up. Was able to buy BIB at 91.50 on July 27t...
ctws.png
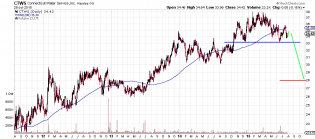
CTWS: Another utility. Volume sucks still liquid for a small position trader. H&S.
1
AEE.png
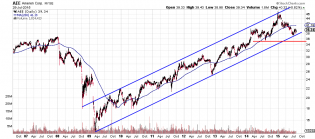
AEE: Utility stock. This sector is now trading under the 200 day MA which will add pressure to any downside trades...
2
nan.png
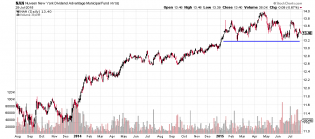
NAN: Head Shoulders. Municipal Fund
2
TUR.png
TUR: Head Shoulders: Huge support here about to break if so then a move down to about 10.00 is reasonable.
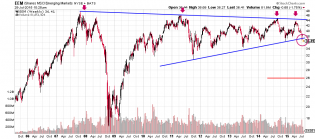
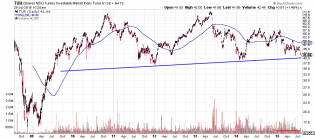
eem.png
EEM Update: Support breaking. Look out below.
1
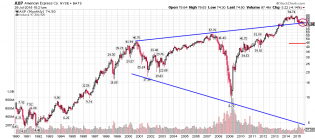
axp.png
AXP: Textbook expanding triangle. Price failed to move higher and reentered the pattern. First target is half poin...
3

bearforceone.jpg
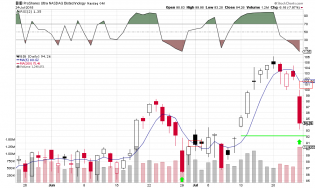
Bib.png
BIB: Using the RSI2 method since this stock is still trading above the 200day MA a reading on the rsi below 10 wou...
1
tril.png
TRIL: Nice symmetrical triangle. Wait for price action. A buy signal would be about $24.50. A reserved target woul...
ewa.png
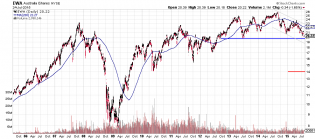
EWA Australia head shoulders top. Wait for this to bounce back to the 200 day ma for the short. Such a quiet count...
2
mdp.png
MDP: Head Shoulders Top.
6
XLU.png
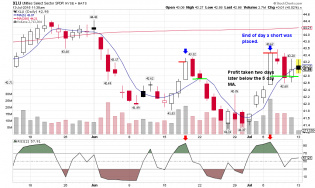
XLU: Short day trade follow up from last week. Trade worked selling short under the 200 day MA when the RSI 2 exce...
2
xlu.png
XLU: Utilities. I want to offer up a day trade style. Since the utilities is now trading under it's 200 day MA one...
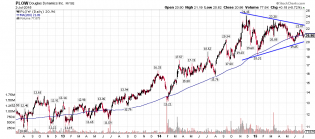
plow.png
PLOW: This is a nice symmetrical triangle. Depending on how much time goes by right now the buy signal break out o...
dwre.png
DWRE update: almost to target of 80.00. This one was a huge symmetrical triangle followed by another smaller symmetri...
dlx.png
DLX: Small head shoulders has confirmed a break down of the neck line with a perfect back test. Price target is 55.00.
1
cube.png
CUBE: Symmetrical Triangle a buy signal is a price break of 24.50 with a short term target of 26.50.
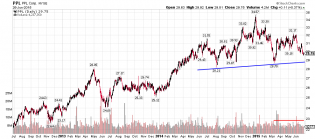
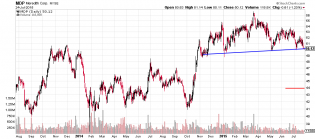
ppl.png
PPL: Utility short head and shoulder top.
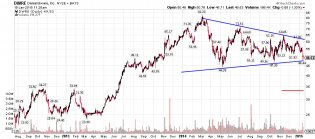
ifn.png
IFN: India going to get crushed.
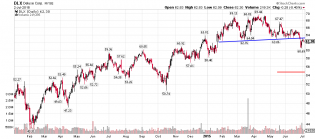
cyh.png
CYH follow up from last month. Off to the races target is still 65.00.
$util.png
Utilities road map.
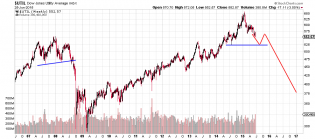
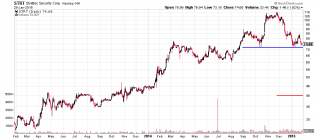
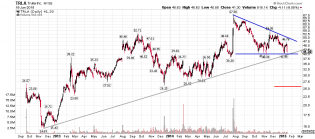
stx.png
STX: Head Shoulders Top for this one.
5
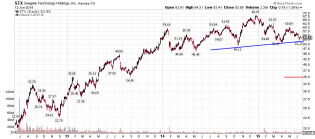
lmt.png
LMT: Head Shoulders Top
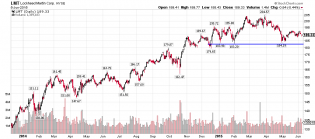
wy.png
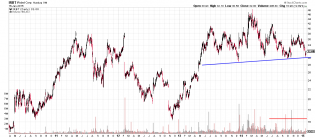
WY: Head Shoulders Top.
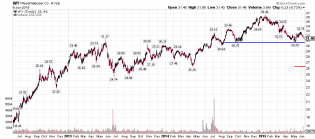
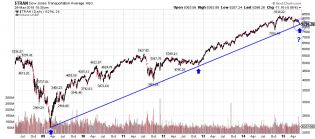
tran.png
$Tran: Uptrend broken. Tim's data trumps all.
5
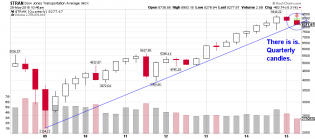
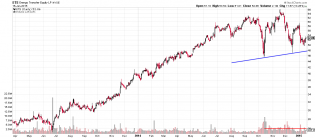
trans.png
$Trans: Transportation Index hasn't quite broken down yet at least according to my data.
4

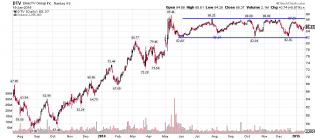
intc.png
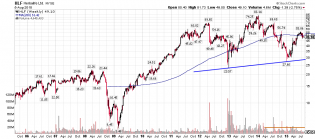
INTC: Bearish case if this is in fact a head shoulders top the gap at 35 could get filled to put in a right should...
2
psa.png
PSA: Symmetrical Triangle. Is a buy signal at $201.00 with a 15-20 dollar move up. A short would be a break of 186.00.
1
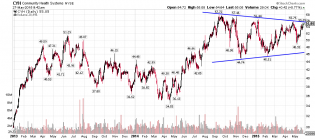
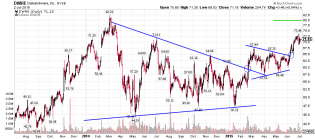
cyh.png
CYH: Symmetrical Triangle. This one may break out to the upside if price crosses 55.75 the target for the triangle...
2
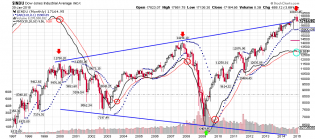
1929.png
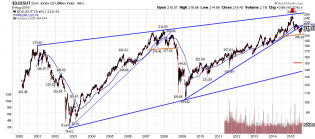
Dow Jones 1929 Chart. I think the crash of 1929 has been depicted as a huge crash that happened over night. Howeve...
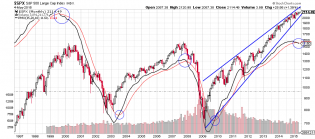
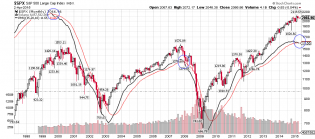
spx3.png
SPX: Watch out below long term.
4
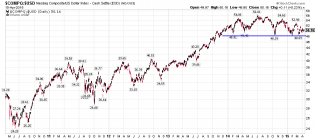
nasdaq.png
Nasdaq Vs Dollar. Head Shoulder Top. The time has come.
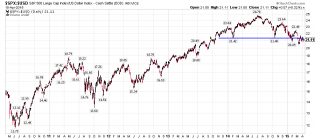
spxusd.png
SPX vs US Dollar. Seems to front run all bear markets long term but here is a five year chart daily. Head Shoulders Top.
atx.png
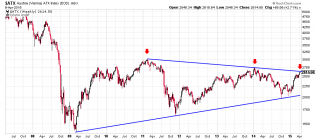
Austria: Will resistance be met again and crush from here or will it blow past it and break out? We will know shortly.
cop.png
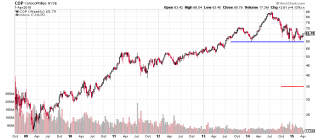
COP: Head Shoulders Top.
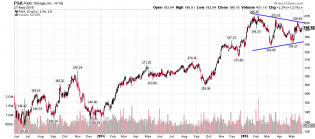
fgd.png
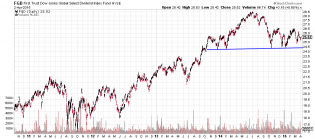
FGD: Head Shoulder Top for this one.
1
dlr.png
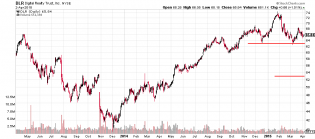
DLR: Head Shoulders Top.
3
spx1.png
SPX: A sell indicator has triggered this month. The catalyst will come out fairly close to the bottom. Will be int...
erie.png
ERIE: Small Head Shoulders Top
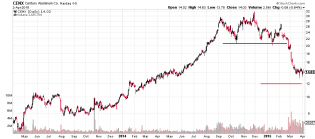
cenx.png
CENX: Update pretty much hitting target, this head and shoulders worked out well.
agio.png
AGIO: Head Shoulders breaking down.
qqq2.png
QQQ: Possible rising wedge. Important reason is the text book volume decreasing. Lets see how this plays out. Tim...
4
dwre.png
DWRE: Symmetrical Triangle target at $80.00
SRE.png
SRE: Head Shoulders Top. Target $96.00
nflx2.png
NFLX update: Slowly but surely hammering out the head shoulders top.
3
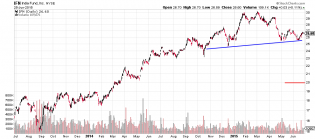
FPRX.png
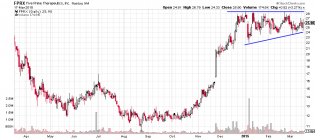
FPRX: Ascending Triangle. A break of 28.50 with a target of $33.00. Wait for the break of resistance.
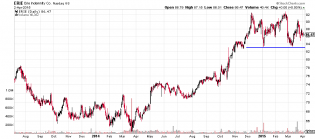
cboe.png
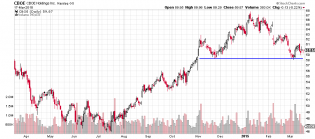
CBOE: Head Shoulders Top.
cpt.png
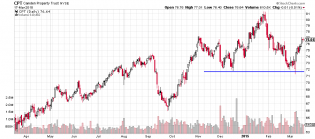
CPT: Head Shoulders Top. Good risk reward here. Target $61.00.
USD.png
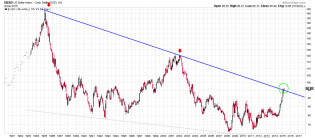
USD: Breaking resistance of 30 years. Typically price would get at least an 80% retrace to the top over many years...
2
jrjc.png
JRJC: Symmetrical Triangle. A price break of of resistance $6.75 would trigger a break out and the target would be...
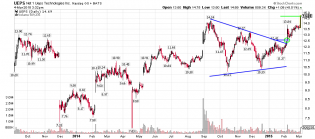
UEPS.png
UEPS Update: I posted this little set up last month in the social trade and price is finally hitting target from i...
1
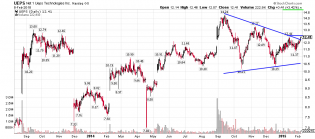
ueps.png
UEPS: Symmetrical Triangle wait for a break of 12.41 target is 15.50.
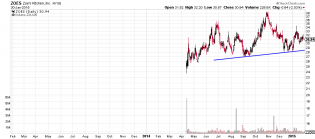
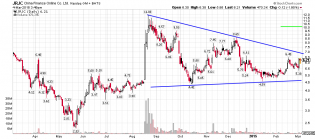
ZOES.png
ZOES: This stock has been born to fail. Head shoulder top right out of the IPO. Target 18.00
jnug.png
JNUG:I see a head shoulders bottom. 75 would be a good target of the pattern. Let's see if it holds.
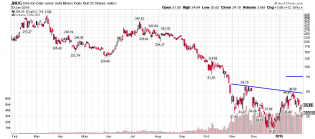
djiamonthly.png
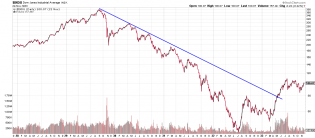
DJIA long term monthly. Today and this month being complete marks a important day for what some may follow is the...
2
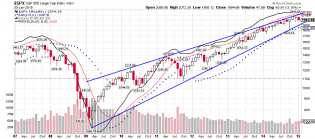
spxlongterm.png
SPX: Monthly rising wedge. When 1900 support is breached have your parachute ready.
1
sc8A0OFMCM.png
HAO: Watch out below if support of the triangle is broken.
nflx.png
NFLX: Long term head shoulders top. Right shoulder possibly building now good risk vs reward.
3
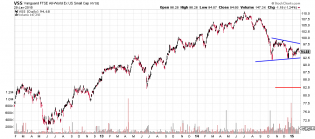
vss.png
VSS: Big Bear Flag. Expect a continuation down once support is broken.
2
thor.png
THOR: Head shoulders top for this Marvel.
CNI.png
CNI: Important support at 65 if broken price should move quickly to $54.00.
strt.png
STRT: Head Shoulders Top. Low volume but it is what it is.
2
irbt.png
IRBT: Head Shoulders Top
3
ete.png
ETE: Head Shoulders Top. Target $26.00
2
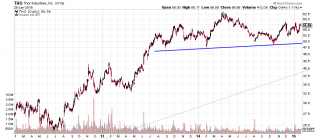
dtv.png
DTV: Rectangle channel neutral pattern wait for a break and roll with it.
3
trla.png
TRLA: Descending triangle. If price breaks support of the triangle it should be at the exact time it breaks the 3...
2
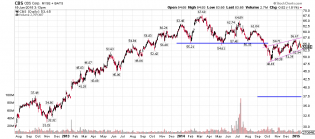
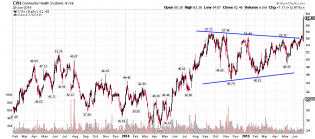
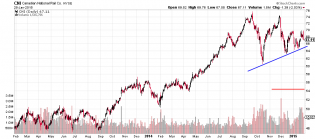
cbs.png
CBS: Now a well defined bear flag to break down and continue toward the gap fill target.
2
dwre.png
DWRE: Symmetrical Triangle. If price breaks support this would be a good short.
4
bbby.png
BBBY: Head Shoulders Top on weekly. This may take a while.
2
mfrm.png
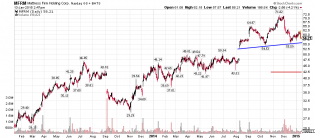
MFRM: Mattress firm not so firm. Head Shoulders Top.
1
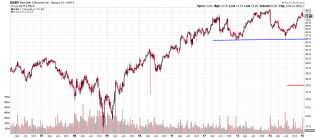
homeconstruction.png
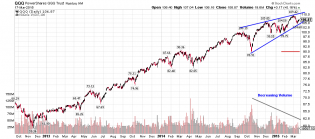
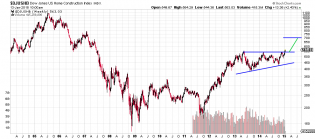
$DJUSHB: Home construction breaking out of an ascending triangle target is $700.00
3