Users: 007 perky pooper: All Pages
s3.amazonaws.com/cdn2.soci..._y7ckgG_l.png
credit inverted shows interesting near upper limit bands, with huge volume, but tiny candle, yet fed funds project...

s3.amazonaws.com/cdn2.soci..._KJFV4T_l.png
large trades after hours, ready for shorting!
vm9U1zCW2D.png
Watch out for rug pull on QQQ dropping
credit market predictor.png
Inverse of IEI/HYG ratio, estimated prediction of market direction, and Bollinger Band (Volatility) limits
s3.amazonaws.com/cdn2.soci..._c6urVY_l.jpg
s3.amazonaws.com/cdn2.soci..._lIet8e_l.png
Enjoy the ride Bears
1
s3.amazonaws.com/cdn2.soci..._ubGHOc_l.jpg
$URNM - three sweeps at today's high. Largest in about a month. Behaving as selling so far. Potential double top a...
TOS_Strat_SOH_10XO_2022-11-03-9.05am-10.55am.png
screen cap of automated trading NQ 2022-11-03 9:05 am - 10:55 am
s3.amazonaws.com/cdn2.soci..._k1dBxK_l.png
Profit trading 1 contract continuous open/close/open, etc always be in a position
5
s3.amazonaws.com/cdn2.soci..._oGYZjc_l.png
sso
vl_qqq.png
less blue bubbles today... don't expect this to continue next week...
2
s3.amazonaws.com/cdn2.soci..._Dt6kW3_l.png
Amazon $AMZN, small volume from Thursday, and small participation at the lows and throughout Friday.
2
s3.amazonaws.com/cdn2.soci..._jOMImq_l.png
s3.amazonaws.com/cdn2.soci..._b3Tgqm_l.jpg
s3.amazonaws.com/cdn2.soci..._eAuPJQ_l.png
IWZM Dark pool at EOD highs
VolumeLeaders.com
poop.png
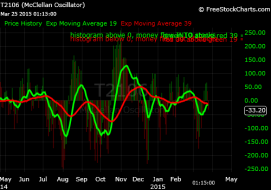
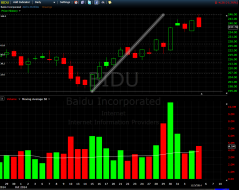
pattern looks similar to late December 2014
TRINQ.gif
Nasdaq TRIN was HIGHER than CHEECH and CHONG. I thin it was RedVetttes would said, never buy the dip when TRIN is...
NFLX.gif
this EOD candle & volume occurred in the last minute of trading. the pattern of the dumping price action makes me...
4
LNKD.gif
this eod candle appears to be buying for tomorrow, since it moved to the halfway mark and tried to form a hammer?...
googl.gif
similar end of day action on the Marissa. EOD panic dumping or buying long into tomorrow? the candle appears as a dump.
AMZN.gif
how do you read this? is this last 15 minute candle spike the entire world dumping, or the entire world buying for...

abe_maria.gif
Abe Maria will shave us

golong.jpg
Capture.PNG
dark cloud cover

rip_dip.jpg

hh.jpg
image.jpg
3

janet_chin_hair_predictor.gif
Janet's Chin Hair Indicator predicts Market Going UP!
2