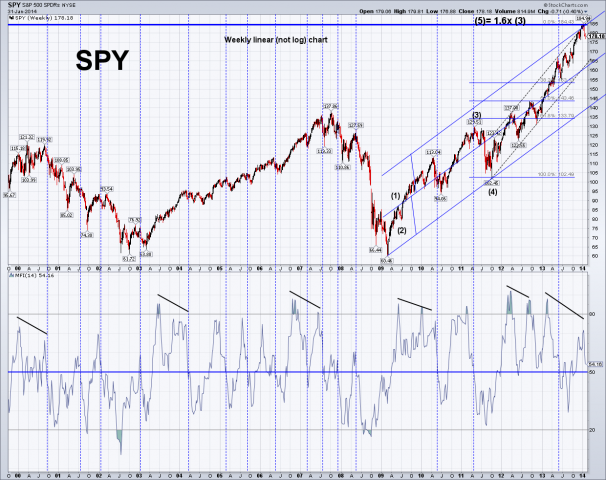
In looking at the linear weekly charts of SPY I see a good channel that fits well with the EW count I prefer which would have the final wave up (5) at 1.6x the third wave (3). This makes me favor the high is likely in. I know most of the blog readers here could give a shit about EW but the proportions are often relevant. You still may want to watch the MFI which when <50 often indicates an intermediate downside potential. But when you look at the log weekly charts and daily charts you see the previous short term low has not be taken out nor has the intermediate uptrend line. So the trend is still up and price is short term oversold so I would not be surprised to see a bounce from here. But all in all if that bounce does not exceed the previous high and the next drop takes out the trend line and previous low I think we are in for some great downside fireworks. Have a great week. Tom 2/1/14


Tom 2/1/14