Users: Tomb: $CPCE daily with 50 MAsc.png
$CPCE daily with 50 MAsc.png
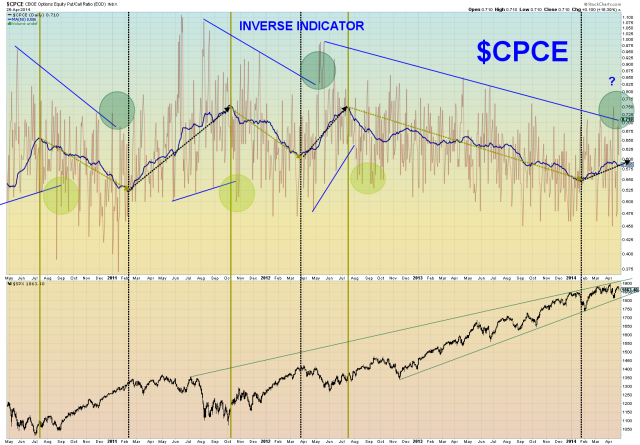
$CPCE daily with the 50 day MA: Some folks see the put/call ratio as an inverse sentiment indicator. It fluctuates widely short term and makes me dizzy. So I follow the 50 MA as a sort of general indicator (independent of price) of longer term market direction. It appears the 50 MA is now going up again indicating sentiment is starting to turn negative. Also notice during an up move in the market there is trend down in the peaks of the actual $CPCE (and vice versa for down markets). At major turns in direction this trend line is broken (shaded circles). It appears this may be occurring now. Have a great weekend. Tom B
Comments
No comments yet.


