Users: Tomb: spy iwm long term.png
spy iwm long term.png
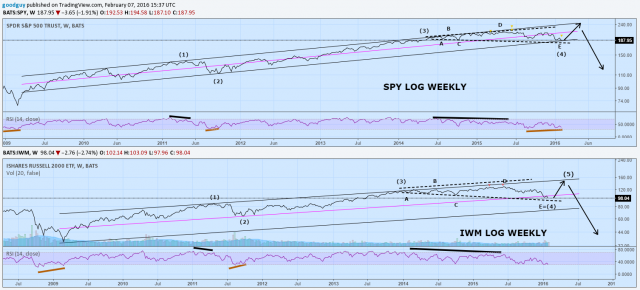
Stocks: One more charge still in the bull?
I like to sometimes stand back and look at the longer term picture. Here are weekly log line charts of the SPY and IWM. The data points are based on the weekly close. Both have seemed to form nice channels. What I find interesting is the price action from the middle of 2014 in both charts looks like an expanding 5 wave triangle. Of course like all patterns I could be seeing or counting it wrong. But if correct it would imply that like there will be one more wave up to complete the long term pattern. Based on shorter term charts I see more down action just ahead followed by a significant rally.
Politically I think this scenario makes some sense since President Obama appears to care about his legacy as much as anything and likely would push for more monetary policy to keep the market afloat til he is out of office. Sentiment wise there seems to be a lot of advertisements about the "crash" just ahead which often means there won't be. Have a great week. Tom B
 pipesticks