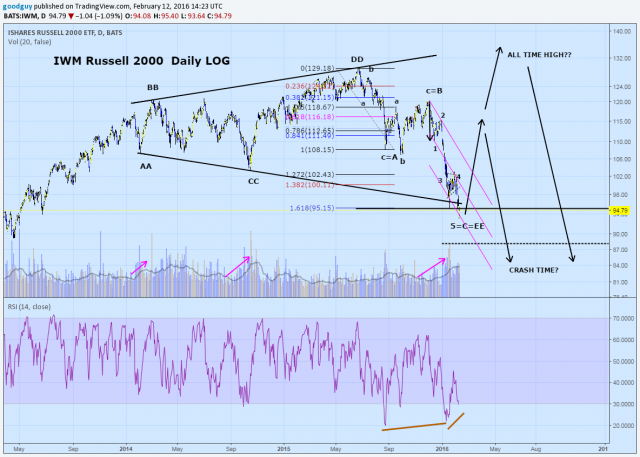
Dink. When I have seen this pattern in smaller time frames sometimes it will lead to new highs that are the top of that times frames move followed be a serious correction. I way I see it is that the bears know things are overbought and overvalued but the bulls haven't given yet and want to keep following the major trend. Sometimes however with this pattern the last wave up is somewhat feeble and just makes it to 78% back toward the recent top or makes a double top and retreats. You may want to look at post today that shows what I think is a huge long term expanding triangle. I know you don't care about fib fans so ignore that part of the chart if you look at it. TB 2/13/16
 Dink
Dink

