View: Picture
Picture
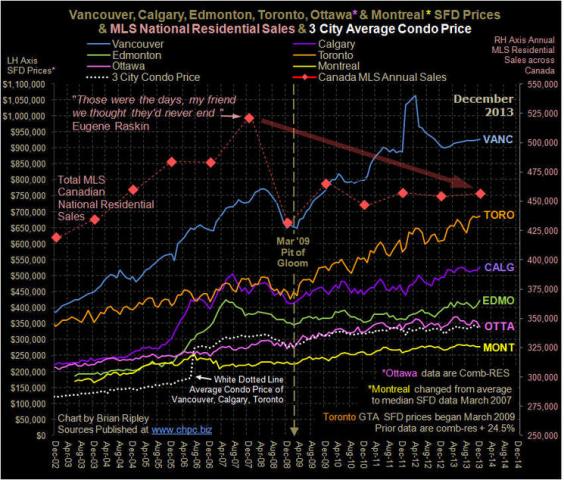
I rebuilt my 6 biggest Canadian Metros Housing Chart and added the average condo price for Vancouver, Calgary & Toronto (the hot 3) and what jumps off the chart is the spring of 2006. The average condo price zoomed 58% (over $100,000) in just 3 months. What happened? Take a look at my CAD Yield Curve Chart: http://www.chpc.biz/yield-curve.html
The yield curve inverted; the 10yr less 2yr went negative and I think what happened is that the buy side of the market freaked out and decided to move all mattress money with leverage into the condo market (the "low" end of the market) as a "safe haven" against capital savings erosion. Ooops, no one told them that inversion spells danger in the credit markets and of course what followed was the slide into the March 2009 pit of gloom. Bye Bye capital gains, hello fundamentals. It's a different story now; real rates are rising, the curve is steepening and fundamentals are real. I think appraisers are going to get their jobs back.
Comments
No comments yet.

