User: Brian Ripley: CAD Debt & Credit
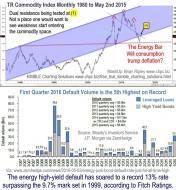
Commodities 1980-2016 & High Yield Defaults
The top panel in the mashup above is the Thomson Reuters Commodity Index chart since the 1980's provided by Kimble...

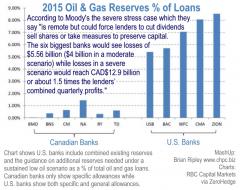
Oil & Gas Reserves % of Loans
I suspect Canada's "information regime" is going to change abruptly if it has not not already. Loans officers are...
1
Canadian Housing Starts 1955 to NOW
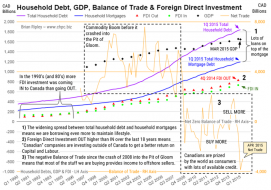
New Chart:
Canadian Household Debt, GDP, Foreign Direct Investment and Balance of Trade ITEM: Canada is the fifth...
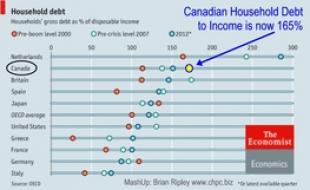
Debt to Income Ratio
There are 3 charts on this page. The top panel shows Canadian Government Spending vs Labour Force Participation an...
1
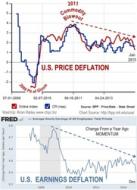
Price & Earnings Deflation 2008-2014
The charts above show the ongoing DEFLATION in consumption prices and wage earnings. The top panel is the MIT Bill...

Aggregate Loan to Value Ratios 1910-2010
When prices stop rising, the boom collapses and because there has been no increase in business investment other th...
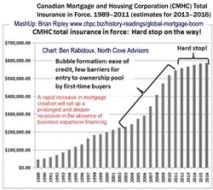
CMHC Mortgage Creation to 2016
Post WW2 and 1970's inflation, Canada has been late to the party and the ongoing Canadian mortgage creation boom r...

Percent of total bank lending 1928-2007
U.S. mortgage loans in banks’ total lending portfolios have doubled from about 30% in 1900 to about 60% today....
Picture
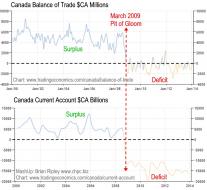
Canadian exports are not booming, there is a global slowdown in demand for commodities, finished products and serv...
Picture
Canada's Minister of Finance suddenly resigned earlier this week. The government's major fiscal policy plank is to...

Picture
The sample price drop building reminded me of New York where the term "jonesing" is said to have originated and th...
4
Picture
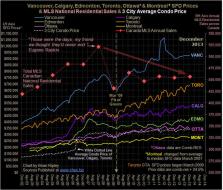
I rebuilt my 6 biggest Canadian Metros Housing Chart and added the average condo price for Vancouver, Calgary & To...
Picture
A 3% handle on a no risk treasury looks pretty good. Imagine what a 4% handle is going to look like and what it wi...
3
Picture
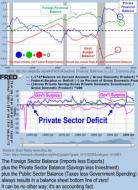
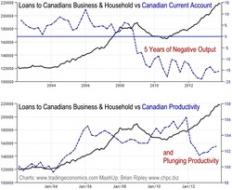
This 4-chart mashup (5 charts in total actually) looks at Canadians (households and business) continuing to vigorousl...
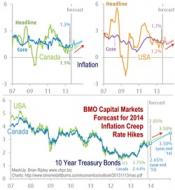
BMO Rate Forecast
BMO Capital Markets Economic Research released their North American Outlook (Nov 13, 2013) which included a foreca...
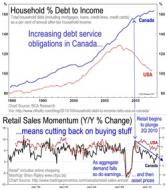
Debt & Sales Momentum
MIRAGE MARKET: Canadians did not see that the housing bubble was over in 2Q 2010. The last 3+ years have been a gi...
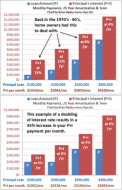
Interest Rate Effect
Anyone who owned real estate in the 1970's and 80's knows that today's real estate prices are highly speculative a...
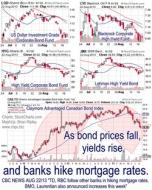
Picture
Here's Mother Nature... next comes Mr Margin. Yesterday Canadian mortgage lenders hiked their posted lending rates...
Picture
"Three-quarters of all Canadian mortgages are insured by the federal government, up from only 30 per cent in 1988....
Picture
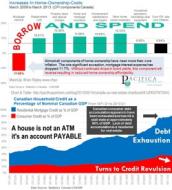
Thanks to Pacifica Partners Inc. we have an update on their chart series showing that Canadians have hit a heavy c...
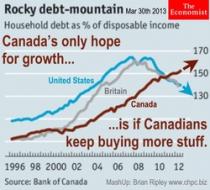
Picture
Canadian Consumers: "...after 11 consecutive years in which household spending has exceeded disposable income, the...
The current animal spirits are still feeding off of debt and Canada continues to be a leader in leveraging it. Canadian credit market debt is now 165% of disposable...
Serial Markets Update - chpc.biz
The current animal spirits are still feeding off of debt and Canada continues to be a leader in leveraging it. Can...