View: Market Harmonics - Nasdaq Sentiment Index
Market Harmonics - Nasdaq Sentiment Index
Comments


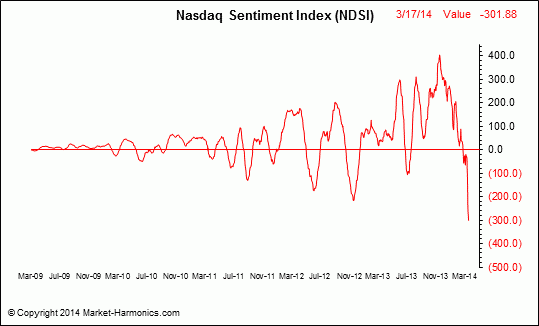
Divergences between the NDSI and NASDAQ Index are signals that warn of reversals, especially at extremes.
http://cdn.socialtrade.com/comsys/imgs/ndx_EwZUSw_m.gif

http://cdn.socialtrade.com/comsys/imgs/ndx_EwZUSw_m.gif


When interpreting the NDSI, keep in mind the following:
1) Divergences between the NDSI and NASDAQ Index are signals that warn of reversals, especially at extremes.
2) The NDSI uses momentum formulas in its construction. Therefore, two key things to look out for are:
a) The distance of the signal line from the zero line. The further from the zero line, the more mature the trend, and the greater the reversal to come.
b) The "speed" of the signal line indicates the strength of the underlying sentiment trend. This is determined by how much the signal line leads its moving average, and how much distance it covers day to day.
3/18/14