User: TNRevolution
Personal Stacks
All Pages Stacked

i1.wp.com/kimblechartingso...wn-feb-13.jpg
USD/JPY long term chart... breaking down this week. Make of that what you will.

1
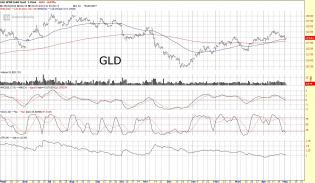
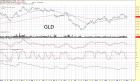
GLD.jpg
An oversold GLD finding support at a rising 50 day mov avg.
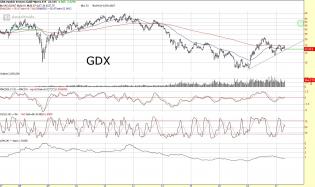
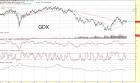
GDX.jpg
GDX target for this year.
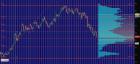
3
GDX.jpg
Nice place to look for a potential bottom to this GDX correction. Touching the 61.8% retrace today, also the POC...
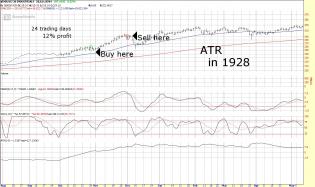
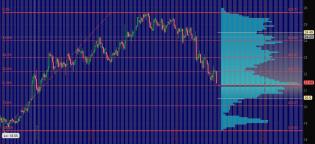
ATR1928.jpg
Nothing new under the sun. These are the kind of markets where ATR shines. If you want a precedent from history,...
3
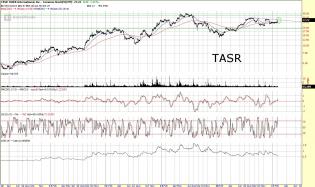
TASR2717.jpg
TASR threatening key breakout.
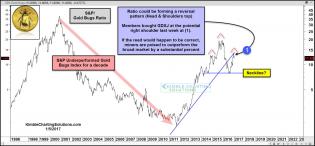
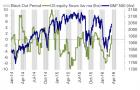
kimblechartingsolutions.co...an-5-2016.jpg
SPX/Gold Miners ratio.
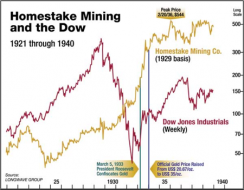
Gold Stocks in a Depression | Casey Research
Woke up in the middle of the night last night thinking Trump would be Hoover... Worth your consideration. ATR, a...
2
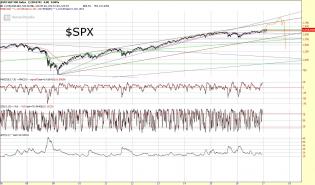
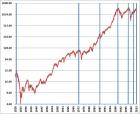
SPX2017.jpg
Around this time every year I seem to do a header post for our beloved Slope. No post this year, but here's a loo...
2
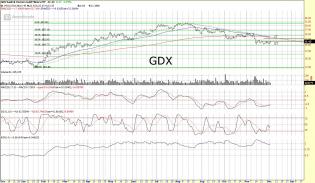
GDX12216.jpg
GDX Update
GDX hitting a very nice 2/3's retrace in both price and time. A trend reversal here to the upside,...
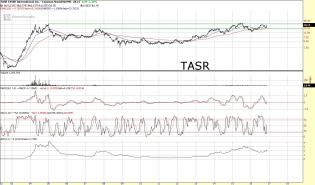
TASR.jpg
TASR long term breakout getting ready to happen, it appears. Not too many charts out there that look like this.
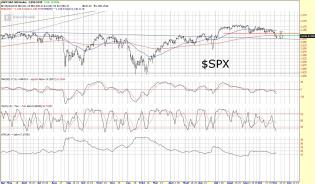
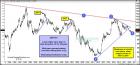
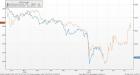
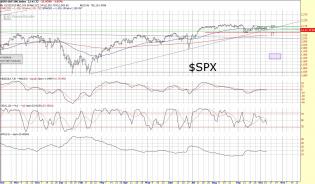
SPX11416.jpg
A bullish perspective on $SPX. We have now backtested the down trend line off the 2015 high. From an oversold po...
4
SPX101016.jpg
$SPX cracked the trend line today off the February low. I think it's reasonable to forecast a possible decline to...
2
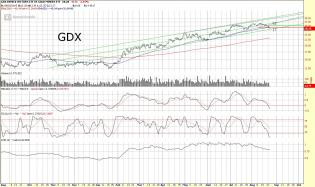
GDX82416.jpg
GDX testing the bottom of my channel here. Very oversold on the daily. Currently trading under IT sell reversal...
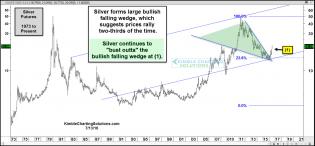
blog.kimblechartingsolutio...e-july-13.jpg
Long term /SI chart. Massive 35 year cup and handle pattern. You want to own silver long term.
2