User: TNRevolution: My Charts
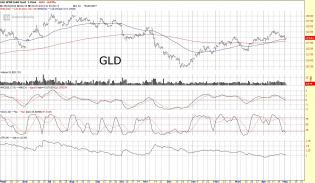
GLD.jpg
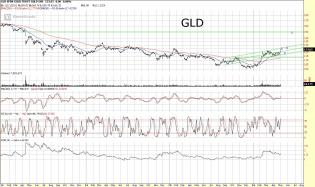
An oversold GLD finding support at a rising 50 day mov avg.

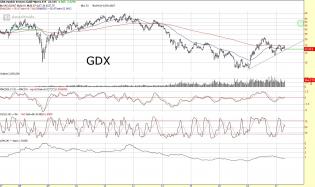
GDX.jpg
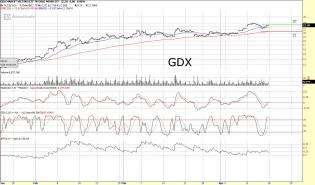
GDX target for this year.
3
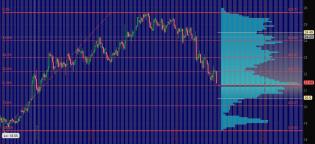
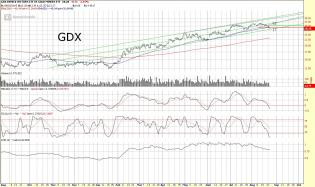
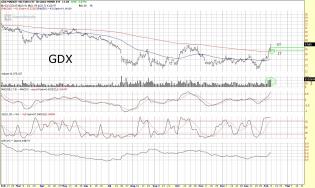
GDX.jpg
Nice place to look for a potential bottom to this GDX correction. Touching the 61.8% retrace today, also the POC...
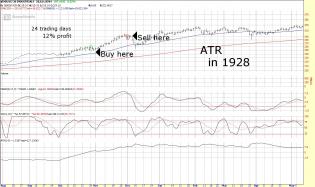
ATR1928.jpg
Nothing new under the sun. These are the kind of markets where ATR shines. If you want a precedent from history,...
3
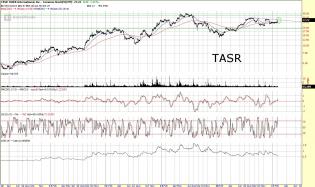
TASR2717.jpg
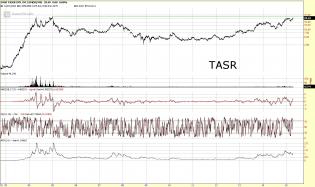
TASR threatening key breakout.
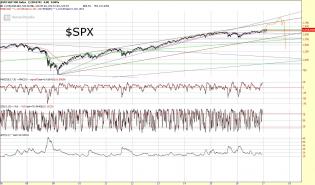
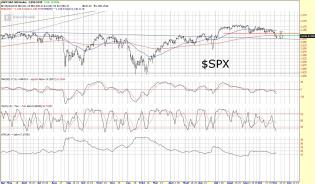
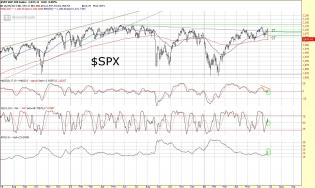
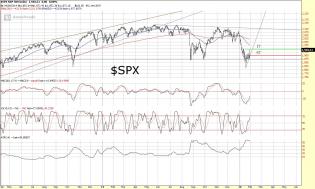
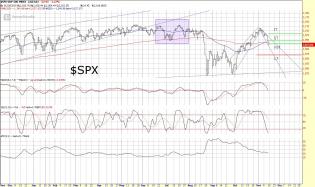
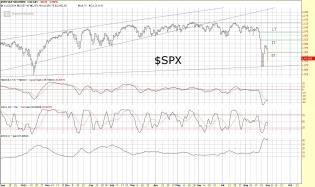
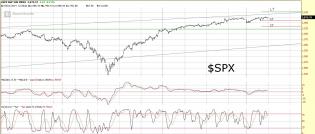
SPX2017.jpg
Around this time every year I seem to do a header post for our beloved Slope. No post this year, but here's a loo...
2
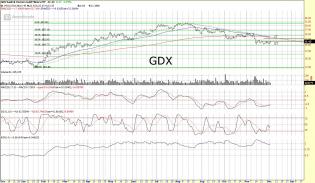
GDX12216.jpg
GDX Update
GDX hitting a very nice 2/3's retrace in both price and time. A trend reversal here to the upside,...
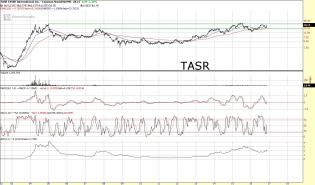
TASR.jpg
TASR long term breakout getting ready to happen, it appears. Not too many charts out there that look like this.
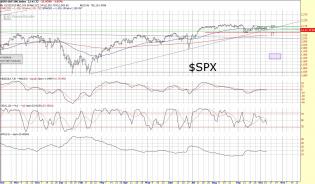
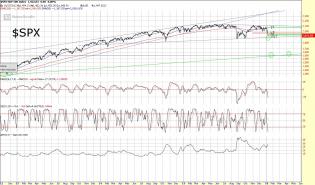
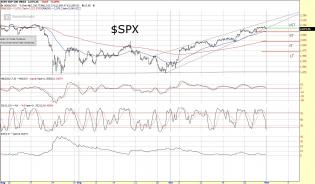
SPX11416.jpg
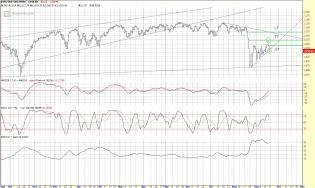
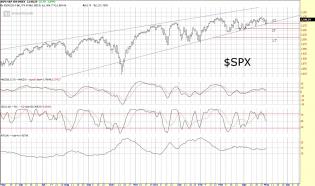
A bullish perspective on $SPX. We have now backtested the down trend line off the 2015 high. From an oversold po...
4
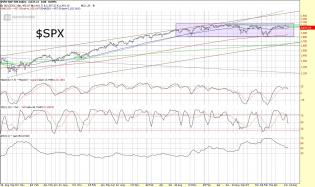
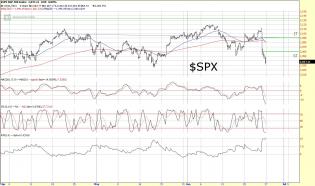
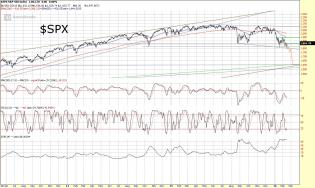
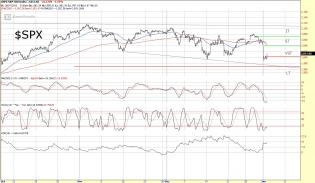
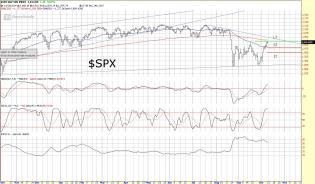
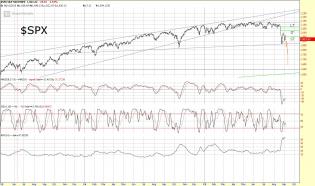
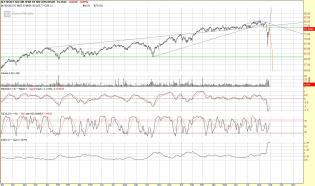
SPX101016.jpg
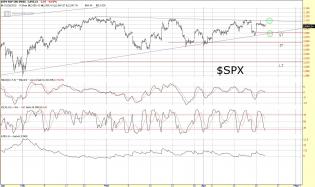
$SPX cracked the trend line today off the February low. I think it's reasonable to forecast a possible decline to...
2
GDX82416.jpg
GDX testing the bottom of my channel here. Very oversold on the daily. Currently trading under IT sell reversal...
SPX624Weekly.jpg
$SPX Weekly Chart
Pulling out to the weekly view, you can clear see the 300 pt range that we've been consolidating...
SPX624Daily.jpg
$SPX Daily Chart
Pulling out to the daily view, we have basically been in about a 300 pt range for the past two...
SPX62416.jpg
$SPX Hourly Chart
SPX saw short term and intermediate term reversal yesterday. SPX moved to an intermediate te...
GLD61916.jpg
GLD Daily Chart
Here is the channel I have been following on the GLD chart. We're nearing the bottom of the ch...
1
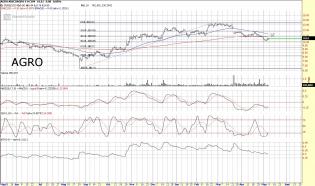
AGRO5616.jpg
AGRO Daily Chart
Best chart I see over the weekend. Already own the stock, but will be looking to add some mor...
1
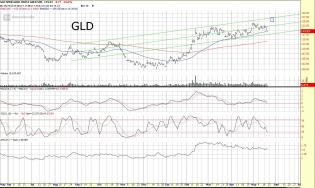
GLD42916.jpg
A look at GLD. Targeting 150 on GLD sometime this summer.
1
SPYGDX.jpg
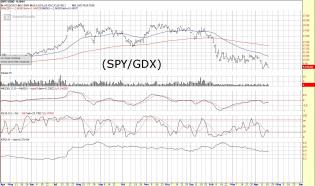
SPY/GDX Chart
Interesting chart. I supposed this was the way the "market" was always going to "crash".
GDX41516.jpg
Here's what my GDX chart looks like. Hedge under 20.50, or add to long term positions over 22.44.
BCO31816.jpg
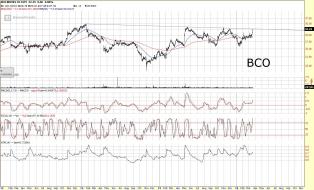
Brinks (BCO)... One to watch.
1
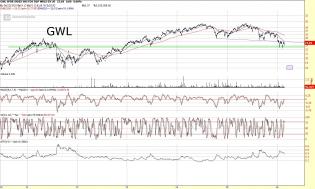
GWL22616.jpg
GWL is an interesting ETF that I've been watching. It tracks the world's developed markets ex-US. It's not a hea...
21216.jpg
Updated $SPX Chart
In a perfect world, the rest of February would look something like this. For the short term...
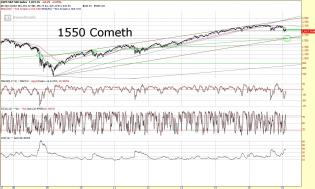
SPX2816.jpg
$SPX 1550 is coming, and I'd say quickly. How the market reacts at that level should tell you everything you need...
4
GDX2516.jpg
GDX Daily Chart
How great has 2016 been so far....and it's only the first week of February. As has been well p...
1
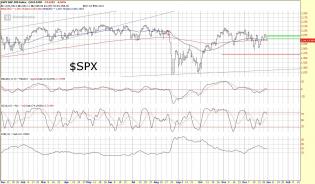
SPX12916.jpg
Update $SPX Chart. Keep it simple. Neckline at 1868. ST sell at 1902. IT buy reversal should offer resistance...
SPX1816.jpg
Key SPX points to watch in the coming months. First, as you can imagine all ATR timeframes are currently on a sel...
1
SPX1416.jpg
Updated $SPX Reversal Levels
VST Buy, ST Sell, IT Sell, LT Buy. ST Buy reversal tomorrow at 2039.,
2
SPX123115.jpg
$SPX saw a short term sell reversal today, closing out the year on a VST sell, ST sell, IT sell, LT buy. Today's...
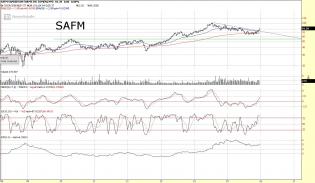
SAFM.jpg
Chicken anyone? Great balance sheet, with zero debt.
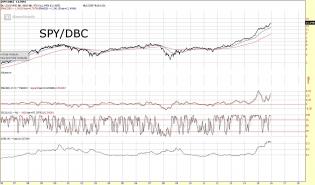
SPYDBC.jpg
I think an important chart to watch going into next year will by the SPY:DBC ratio. Once this parabolic rise brea...
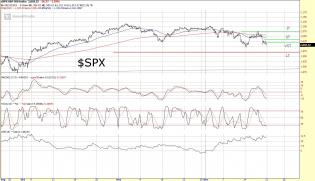
SPX121815.jpg
Updated $SPX Reversal Levels
Very Short Term Sell, Short Term Sell, Intermediate Term Sell, Long Term Buy
3
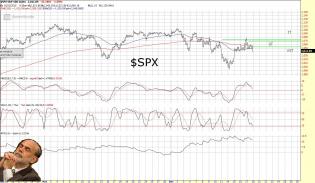
SPX121715.jpg
SPX had a short term sell reversal today. Updated reversal levels shown.
2

content.screencast.com/use.../VIX12315.jpg
Key level approaching in the VIX.
1
content.screencast.com/use...SPX111315.jpg
Updated SPX Reversal Levels.
VST Sell, ST Sell, IT Sell, LT Buy. Seeing some similarities to the mid-July move.
1
content.screencast.com/use...SPX103115.jpg
$SPX Reversal Levels
Very Short Term Sell, Short Term Buy, Intermediate Term Buy, Long Term Buy.
1
content.screencast.com/use.../SPX10915.jpg
$SPX Daily Chart
Reversal levels are currently on a short term buy, intermediate term buy, and long term sell....
3
content.screencast.com/use...929Analog.gif
1929 Analog Update
content.screencast.com/use...%20Update.jpg
Analog Update
1
content.screencast.com/use.../NYA91815.jpg
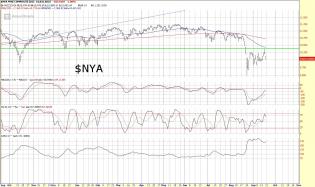
Beautiful technical look at the $NYA
The green horizontal line is the 2007 top, which the $NYA now has a failed...
content.screencast.com/use.../SPX91815.jpg
Update $SPX Reversal Chart
SPX reversed back to a short term sell today, putting all three timeframes on a sell...
2
content.screencast.com/use...1/SPX9415.jpg
Game plan for next week. Have a great three day weekend!
1
content.screencast.com/use...a/SPX9115.jpg
Update reversal levels for SPX.
Short term reversal higher tomorrow would be above 1950. Below that, I highly...
1
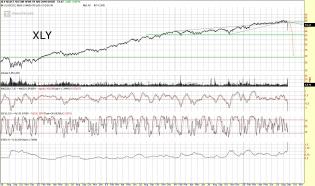
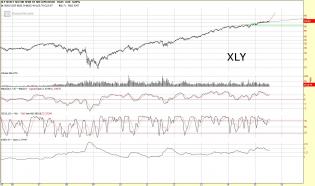
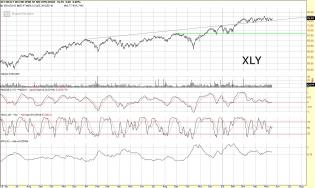
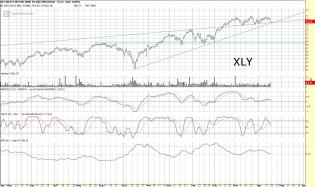
content.screencast.com/use.../XLY82815.jpg
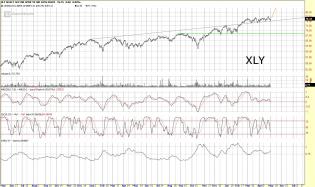
Put up or shut up time.
Years of research on 1929, and there is the setup staring you straight in the face. Do...
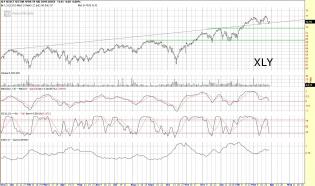
content.screencast.com/use.../XLY82715.jpg
As of this morning, out of all longs I that I don't want to hold for the long term. When this trendline breaks, I...
2
content.screencast.com/use...b2bd/1929.jpg
1929 DJI
content.screencast.com/use...84e97/XLY.jpg
Tim, here's the scenario 3, the crash scenario I was talking about. Compare it to the 1929 chart, I'll post next.
1
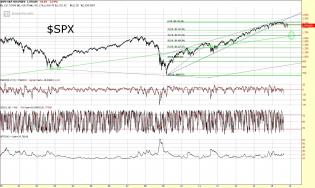
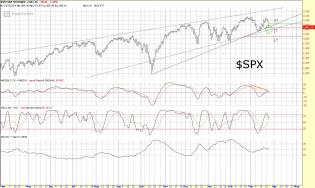
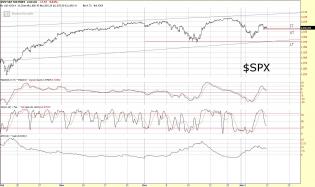
content.screencast.com/use.../SPX82315.jpg
$SPX Long Term Chart
If the market is indeed setting up to rollover off this year's top, I would suggest the 15...
2
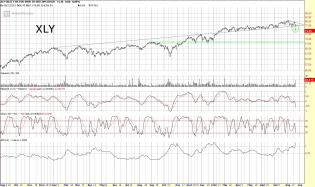
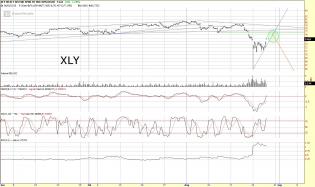
content.screencast.com/use.../XLY82215.jpg
XLY Daily Chart
The trendline on XLY that I've been watching all year ruptured on Friday. As a result, I got s...
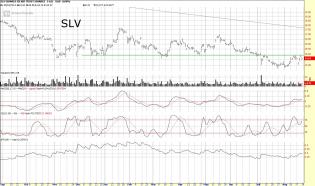
content.screencast.com/use...904d/SLV1.jpg
SLV Daily Chart
One thing that has been working swimmingly over the past month has been precious metals, and in...
1
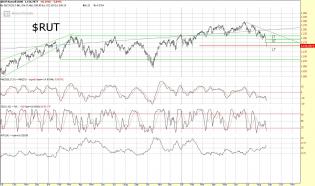
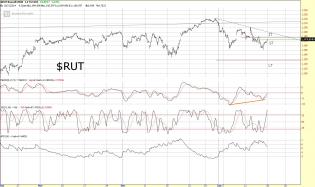
content.screencast.com/use.../RUT82215.jpg
$RUT Daily Chart
Wild week, eh? Congrats to the bears who profited. I'll get the next one, promise. ;) Until...
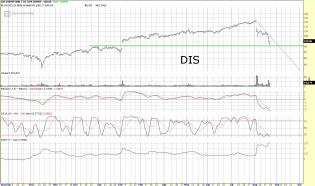
content.screencast.com/use.../DIS82115.jpg
DIS Daily Chart
1
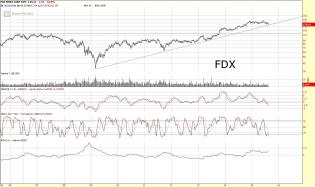
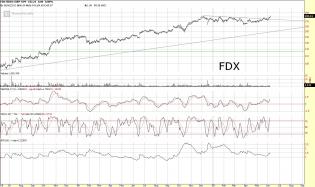
content.screencast.com/use.../FDX82115.jpg
FDX tagging trendline this morning off the 2009 low.
1
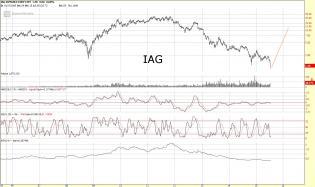
content.screencast.com/use.../IAG72415.jpg
IAG Weekly Chart.
content.screencast.com/use.../XLY72415.jpg
XLY Weekly Chart.
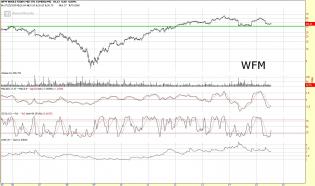
content.screencast.com/use.../WFM72415.jpg
WFM Weekly Chart.
A buy above 35.
content.screencast.com/use...c/FDX6515.jpg
FDX Daily Chart
1
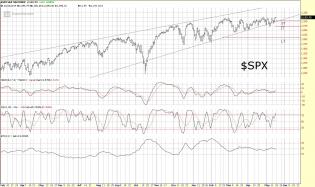
content.screencast.com/use.../SPX51515.jpg
$SPX Daily Chart
Wedge still holding. On a buy on all timeframes, testing a breakout to new highs.
content.screencast.com/use.../XLY51515.jpg
XLY Daily Chart
Breakout support still holding. Could start a new upleg higher at any time.
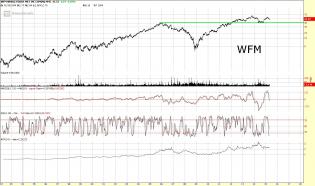
content.screencast.com/use...9/WFM5615.jpg
Here's betting it never drops below that green line this year. I'll be buying the dip when it turns up.
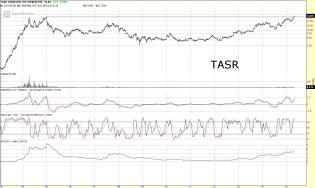
content.screencast.com/use.../TASR5515.jpg
TASR Weekly Chart
If that's not a beautiful chart, I don't know what is.
2
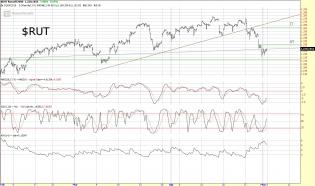
content.screencast.com/use...4/RUT5115.jpg
$RUT Hourly Chart
Some damage was done to the Russell this week, as it showed the most weakness of the major in...
content.screencast.com/use...3/SPX5115.jpg
SPX Daily Chart
Wedge support continues to hold for SPX. It remains on a buy on all three timeframes.
content.screencast.com/use...2/XLY5115.jpg
XLY continues to hold it's breakout support. I continue to expect higher prices and market leadership here.
content.screencast.com/use.../SPX42215.jpg
The view from here... Key areas circled in green.
content.screencast.com/use...TASR41715.jpg
A long term look at TASR. Really pretty pattern.
content.screencast.com/use.../XLY41715.jpg
XLY Daily Chart
I think that chart about sums it up.
content.screencast.com/use.../XLY32715.jpg
XLY Daily Chart
If the market doesn't start to fall apart next week, Consumer Discretionary is probably going t...
content.screencast.com/use.../SPX32515.jpg
Pretty significant reversal today across all indices. SPX closed below its October trendline, after bouncing off...
2
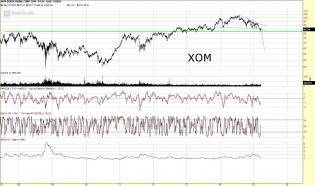
content.screencast.com/use.../XOM32215.jpg
Exxon looking very vulnerable there. I have no position in the stock, but would happily buy some on a major washo...
2
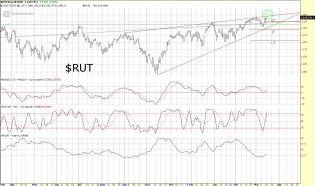
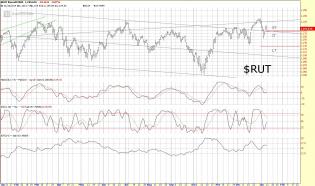
content.screencast.com/use.../RUT31615.jpg
Updated $RUT Daily Chart
After successfully backtesting the breakout of the 1212 level, the Russell has continu...
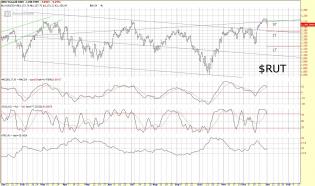
content.screencast.com/use...a/RUT3615.jpg
$RUT Daily Chart
Here's your TnR weekend update. The Russell finally got a short term sell reversal this week,...
1
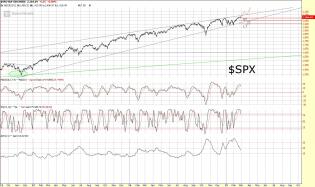
content.screencast.com/use.../SPX22715.jpg
$SPX Daily Chart
The view from here.
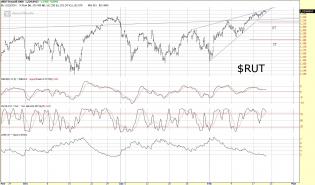
content.screencast.com/use.../RUT21915.jpg
$RUT Hourly Chart
From a charting perspective, easy to see why this has been a boring week, as we're at the top...
3
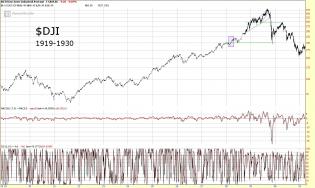
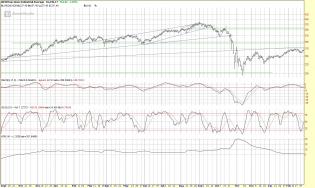
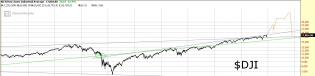
DJI1928
Repost of the 1928 analog that posted back in December. On that chart we're just now breaking to new highs in mid...
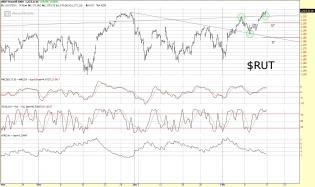
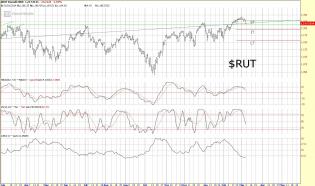
content.screencast.com/use.../RUT21315.jpg
$RUT Hourly Chart
The Russell continues to perform beautifully, from the bullish perspective. The rise that be...
3
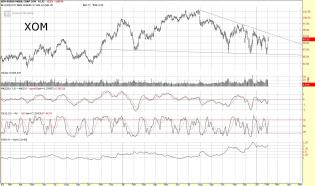
content.screencast.com/use...e/XOM2415.jpg
Here's what my XOM chart looks like. Whichever of the two trendlines breaks should yield a nice move. I would le...
1
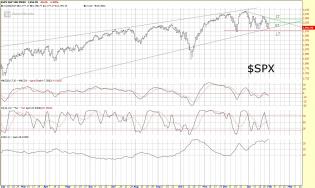
content.screencast.com/use.../SPX13015.jpg
$SPX Daily Chart
Nice clean chart with good reversal levels either way, I like it. The good news is this 2 mon...

content.screencast.com/use.../RUT12815.jpg
$RUT Hourly Chart
Starting to get a bit more interesting in bearland, eh? Today's action moved the Russell to...
3
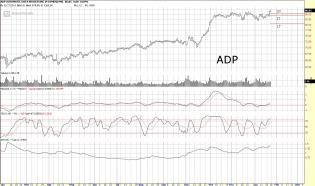
content.screencast.com/use.../ADP12315.jpg
ADP Daily Chart
Another long idea from the Rev? Some good individual opportunites inside the Russell, ADP bein...
1
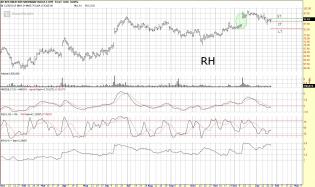
content.screencast.com/use...6/RH12315.jpg
Baby, go buy yourself something nice. The money printers are still on, and the upper-middle class is feelin' thei...
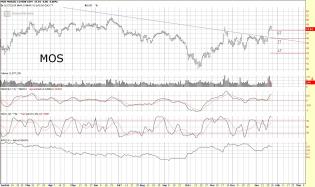
content.screencast.com/use.../MOS12315.jpg
MOS Daily Chart
Let's take a look at how to use reversal levels on different timeframes to time entries into ne...
1
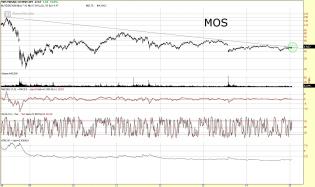
content.screencast.com/use.../MOS12015.jpg
MOS Daily Chart
Keep an eye on TNH and MOS, both up big today. No crap! MOS breaking out of 6 year downtrend.
content.screencast.com/use.../RUT11615.jpg
$RUT Hourly Chart
The Russell broke through to a short term buy reversal this afternoon. It remains on a long...
2
content.screencast.com/use...1/SPX1915.jpg
$SPX Hourly Chart
Update ST and IT reversal levels. ST Buy, IT Buy, LT Buy
The ST and IT reversal levels have...
content.screencast.com/use...6/RUT1915.jpg
$RUT Daily Chart
Updated ST and IT reversal levels. ST Buy, IT Buy, LT Buy.
ST and IT have clustered together...
1
content.screencast.com/use...f/RUT1215.jpg
$RUT Daily Chart
Updated ST, IT, LT Reversal levels. Currently on a short term sell, intermediate term buy, lo...
2
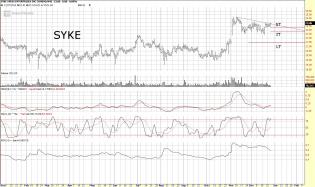
content.screencast.com/use...YKE122614.jpg
SYKE Daily Chart
Here's a tasty long setup for your weekend viewing pleasure. I've been stalking this one for...
content.screencast.com/use...928Analog.jpg
Since I'm bored this weekend, and really like charts... I went ahead and put together rough outline of what a 1928...
1
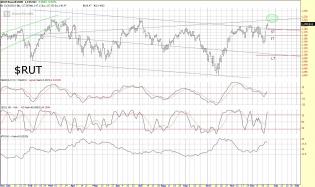
content.screencast.com/use...RUT121914.jpg
$RUT Daily Chart
Just one chart this week to look at. I'll be gone most of next week. Updated intermediate an...
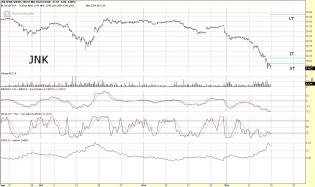
content.screencast.com/use...JNK121214.jpg
JNK Hourly Chart
Probably the most important market to watch for the next few weeks/month... If we can see a r...
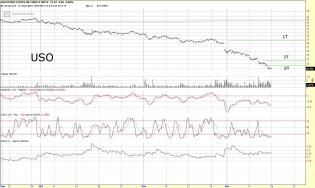
content.screencast.com/use...USO121214.jpg
USO Hourly Chart
Updated short term and intermediate term reversal level. USO continues to be the primary driv...
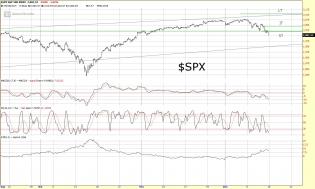
content.screencast.com/use...SPX121214.jpg
$SPX Hourly Chart
Updated short term and intermediate term reversal levels. $SPX continues to show the weakest...
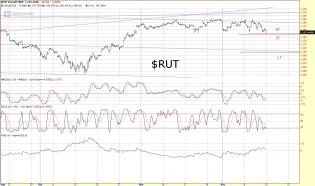
content.screencast.com/use...RUT121214.jpg
$RUT Hourly Chart
Updated short term & intermediate term reversal levels. Of the major indices, the RUT continues...
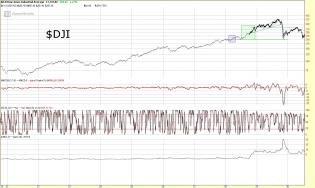
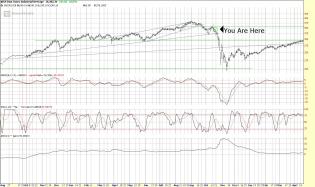
content.screencast.com/use...d/DJI1928.jpg
Are we here?
The previous record for consecutive days above the 5DMA is show in the purple box. What followed...
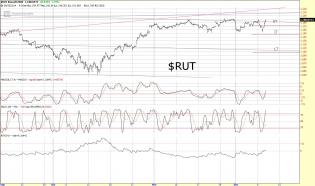
content.screencast.com/use.../RUT12914.jpg
$RUT Hourly Chart
Amazingly enough, the Russell reversed hard back higher today, and reversed back to a buy on...
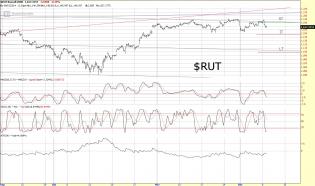
content.screencast.com/use.../RUT12814.jpg
$RUT Hourly Chart
Today's selloff moved the Russell to a short term sell. Chart continues to look rather chopp...
2
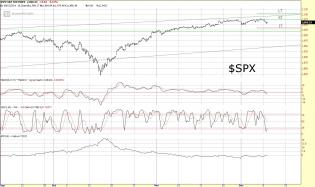
content.screencast.com/use.../SPX12814.jpg
$SPX Hourly Chart
Today's selloff moved SPX to a short term sell. The chart still looks relatively choppy in h...
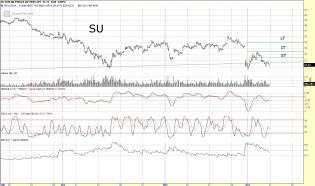
content.screencast.com/use...7/SU12514.jpg
SU Hourly Chart
Best short among the oil majors? It may be. I like it as a short over the likes of XOM and CO...
1
content.screencast.com/use.../SPX12514.jpg
$SPX Hourly Chart
Updated ST & IT reversal levels. $SPX is on a buy ST, buy IT, and interestingly still a sell...
content.screencast.com/use.../RUT12514.jpg
$RUT Hourly Chart
Updated ST and IT reversal levels. The Russell remains on a buy on all timeframes.
2