User: TNRevolution: My Charts: 21216.jpg
21216.jpg
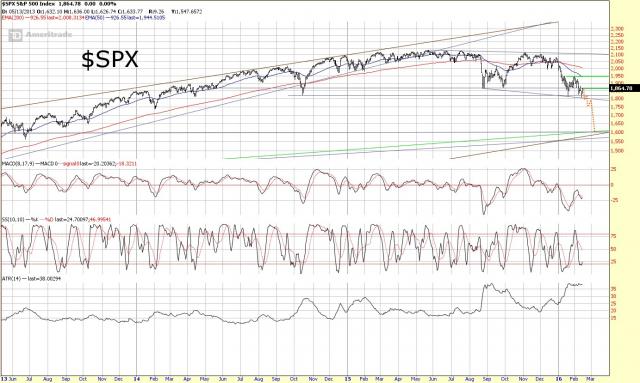
Updated $SPX Chart
In a perfect world, the rest of February would look something like this. For the short term the SPX 1868 level is key for the ST trend. Not only is that level a ST buy reversal level, but its a also a backtest of the former neckline level, as well as the key breakdown level of the past few weeks' smaller head and shoulders. Above it would be bullish for the short term, below it, the trend remains bearish.
The declining trendline off the Aug low also shows the declining H&S that has formed over the past 6 months. A move below that neckline should lead us quickly to the 1550-1600 area. This area (1550-1600), as I've opined for months will be the key level for me to watch to determine if this correction is over, or if it is the mid-point of a much larger move.
Comments
No comments yet.


