View: SPY 5.12.14daily.png
SPY 5.12.14daily.png
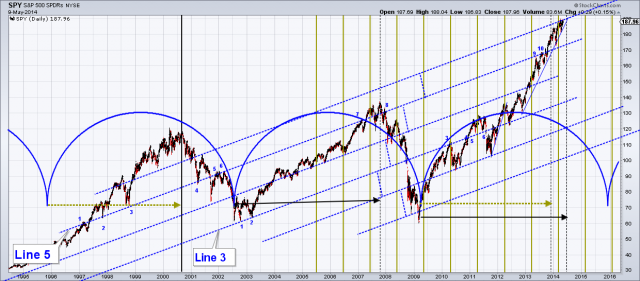
Spy daily. Slopers am I crazy? I participate on this site to learn and to share. So give me some feedback here please. I am not really a believer in time cycles. But a couple of years ago when bored on a Saturday afternoon I created this chart in seeing the obvious last couple of "cycles" of SPY. There seems to be about a 6.5 year cycle (as someone pointed out N=2 not impressive) indicated by the larger arcs. Then in playing around there seemed to be an about a 11 month cycle (vertical lines) that seemed to pick fairly well the intermediate highs. I then happened to draw line 3 that had multiple points of contact. (8? can that be chance?) So for some reason I drew a few parallel lines and noticed line 5 had like 9 points of contact at that time. At the time I personally never thought the SPY would ever reach the top line. But it did right at the vertical line and about at the same region of the larger "cycle" as the previous highs. Does this mean anything?? Or is this crazy "lineology"? Feedback: positiv
 Tomb
Tomb