View: 2015-10-15-TOS_WMT.png

2015-10-15-TOS_WMT.png

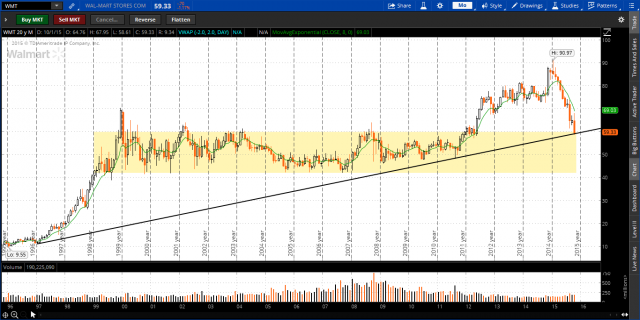
A little closer look at $WMT tonight. 
Coming back into the top of an area in which it spent 13 years consolidating.  
Sitting right on a monthly trend-line that goes back to 1996. 
2 days of way above average volume. 
Day 3 rule in effect. 
Decent dividend at this price. 
Took a starter today in a longer-term account. Will add on strength, or cut it quickly if the free-fall continues.  
Knife-catcher's anonymous (KCA) trade - not for everyone.

Comments

007Dad007Dad
that may work 10/15/15
Mr. WizardMr. Wizard
My personal preference would be to draw the trendline at a slightly steeper angle, touching to bottoms of the candle bodies, and not the lowest point. This would mean the stock has already broken through the trendline. I'd expect it to try and retest the underside of the line next. After that, ??? 
Good luck. Yes, not for me, but I would have bought it in my younger days :) 10/15/15
10/15/15
MovinFwdMovinFwd
What were the fundamentals at that blow off top that caused it to stall and drop like a stone ? 
What has changed ? 
I realize your trade is a technical chart trade.  
Just making after hours small talk trader talk, not questioning your trade. 
10/15/15
Useful IdiotUseful Idiot
13 years. 
Nothing peculiar about that number............ ▲ 10/16/15
...