
View: slopechart_$SPX.jpg
slopechart_$SPX.jpg
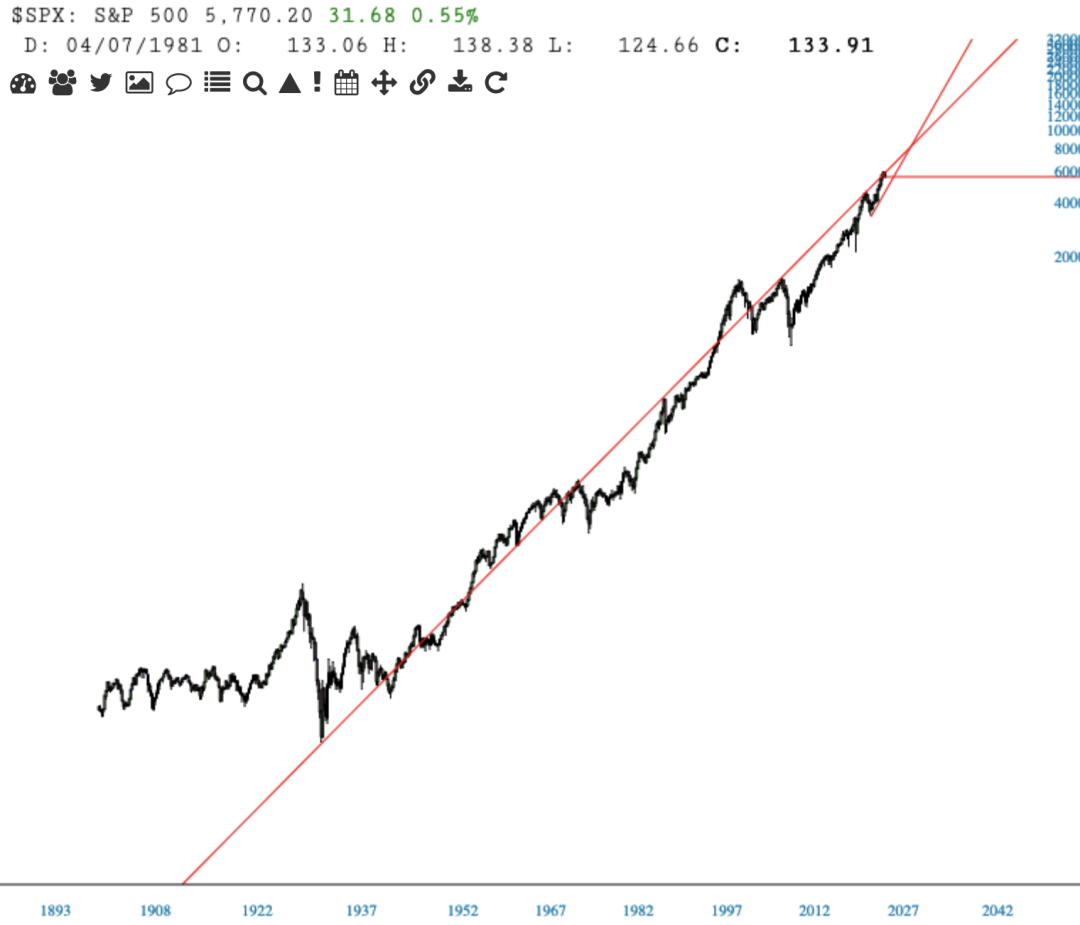
My last chart made me realize that I needed to add more crayon red lines. Just in case the one I had doesn't do anything.
I figure if I draw a bunch of them I can be right more often.
And heck, maybe this thing is actually going to go down for the first time in 16 years. Best be prepared!
Comments
Fwiw, this is Tim's spx chart. Two lines! Close-up, there's a third. I think it's great. Not saying yours isn't; just sayin'. 


That "might" be a logical spot for a bounce, but I'd prefer that at least one other line also saw a bounce, or a rejection. 3/7/25