Browse Stacks: Trading: ETFs
slopechart_KSA.jpg
KSA

slopechart_XME,METL.jpg
Metals
1
slopechart_QQQ.jpg
QQQ
Somebody might know what is next, but it ain't me.
However, it has been my experience that when boring l...

slopechart_$TRAN.jpg
423.6, because who doesn't love whimsical random number generators with their morning coffee?
This is the DOW Tran...
slopechart_BITO.jpg
BITO, which pays magical dividends based off the "who F'n knows?' trade, just decided it didn't like its 3 year bu...
slopechart_$SPX.jpg
S and P
TRADE YOUR VISION they said.
My vision is blurry, blighted by some cornea problem that can't be repa...
1
slopechart_QQQ.jpg
QQQ
The left side of this amazing chart is a steady procession of mostly unremarkable candles going up. When th...
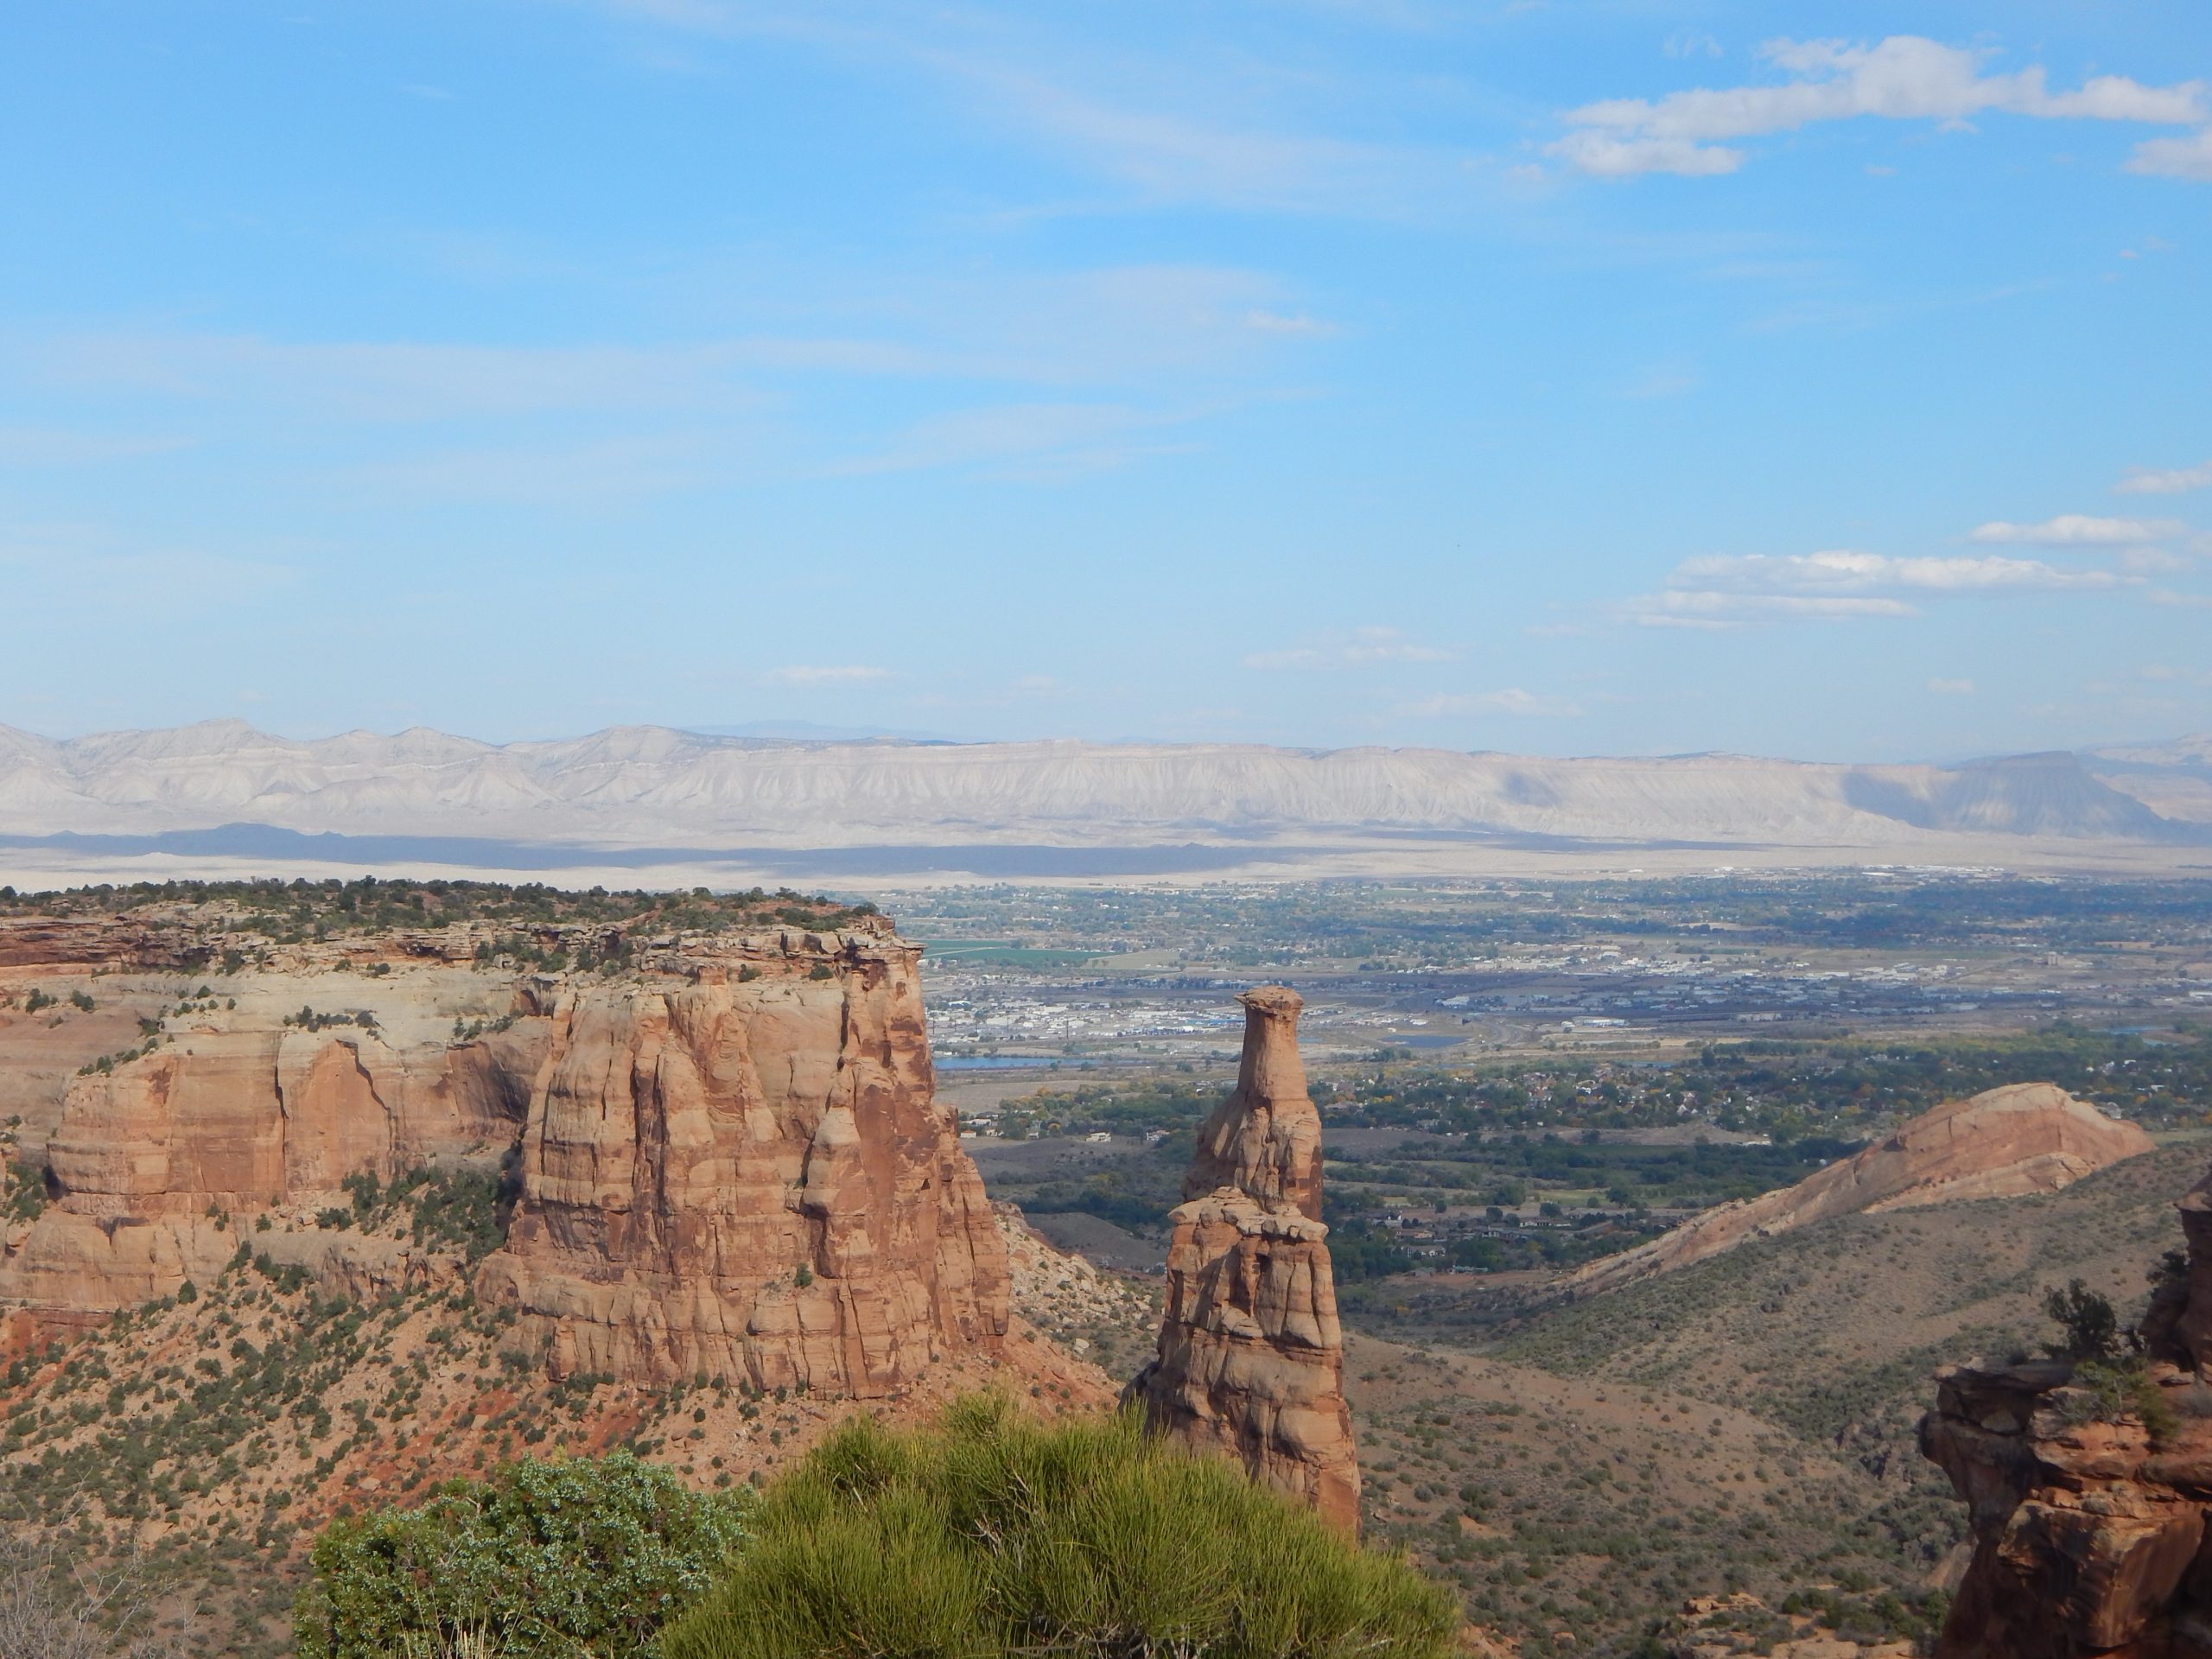
image-120-1024x706.jpg (1024×706)

slopechart_IFN.jpg
11% yield
paid in shares
slopechart_OEF.jpg
Caressing the head of the thing can take some time before the desired outcome is achieved.

1
slopechart_OEF.jpg
This could get ugly one day.
slopechart_GDXU.jpg
slopechart_IBIT/GLD.jpg
$IBIT v $GLD
slopechart_SPY.jpg
The blowoff top could be significant. Everybody into the pool! And then the water turns to acid.
slopechart_$SPX.jpg
My last chart made me realize that I needed to add more crayon red lines. Just in case the one I had doesn't do an...
3
slopechart_$SPX.jpg
The nice thing about a chart is that they are somewhat static. You draw some lines and stuff and then watch.
No...
Chart Advisor: Tesla Inc. – (TSLA)Chart Advisor: | Traders' Insight
dummy

0 - 2024-11-26T094122.887.jpg (853×560)
ETFs win!
2
slopechart_TUA.jpg
Mike Green's 5x leveraged ETF on 2 year rates
2
Capture d'écran 2024-01-29 234311.png
S&P still not at ATH compared to bills and is now facing pot resistance

zferg.png
Hey I've found it, calling XIV a bubble on Jan 5 2018
The top was Jan 11th
One of my most precise (and accurate...
1
slopechart_EPOL.jpg
long term still in a downtrend, but rocking short term - Poland
slopechart_BJK.jpg
another gambling ETF
this one has LVS as its top holding
slopechart_BETZ.jpg
for your gambling needs
looks like it was started during the lockdown
slopechart_BITO.jpg
bite-o-wedge
slopechart_EPOL.jpg
Kiss me, I'm Polish - a cool double since Oct
slopechart_XLP.jpg
XLP pulling back from trendline resistance
1
slopechart_XLK.jpg
XLK channel
s3.amazonaws.com/cdn2.soci..._o0u4sz_l.png
COT for NG

slopechart_CANE.jpg
1
slopechart_XLV.jpg
Frothy
slopechart_ERY.jpg
ERY looking to fill open gap with good risk/reward off potential bottom here.

slopechart_TLT/(3*XLF).jpg
Long TLT, short XLF is an interesting pairs setup. This ratio has been steadfastly obeying a channel since the GF...
1
slopechart_XBI.jpg
Watching for a reentry point on XBI. Ideally around $106, but I don't know if we'll get there. Lot's of XBI is a...
slopechart_ARKK.jpg
Interesting where ARKK stopped dropping - just touched it's long term support. If it breaks through, look out below.
slopechart_XLK.jpg
XLK hasn't really taken a beating yet. In fact it just tapped against resistance yesterday (11/22). Over 50% of...
slopechart_IEF.jpg
Glad I held on to my IEF puts yesterday, although they hit my stop loss level.
slopechart_KRBN.jpg
Crappy options, but has been on a tear while Euro companies needed carbon credits. With the confluence of Europe...
1
slopechart_IWM.jpg
First time doing this I'm new here.
3
slopechart_IWM.jpg
The range is narrowing, the squeeze is on. Declining volume
3
slopechart_URA.jpg
Radiant
slopechart_UNG.jpg
Cold winter ahead (solar minimum)
slopechart_SLV.jpg
slopechart_USO.jpg
Possible convergence around 62. Currently a shade below 50. Possible indicator of ongoing material inflation.

slopechart_VNQ.jpg
https://www.msn.com/en-us/money/realestate/the-new-real-estate-normal/ar-AAMir6k
Maybe VNQ breaks up when the tri...
slopechart_$OEX.jpg
S@P looks like it will be boring for a bit. Post-lockdown explosion is out of gas.
slopechart_XHB.jpg
Nope, no housing bubble this time. A run on existing homes maybe, but commodity prices are making new constructio...
slopechart_BKLN.jpg
Senior Loans may survive better if Inflation takes off.
slopechart_TLT.jpg
TLT had it going for a month. Now it could take out 125 by Early June
s3.amazonaws.com/cdn2.soci..._sZpsNt_l.png
Bitcoin ETF
s3.amazonaws.com/cdn2.soci..._DF9jEY_l.png
AGS coming out of a multi year downtrend
1
slopechart_GDX.jpg
The dotted line is the level at which the 2012 H&S triggered resulting in an extended bear market.

3
slopechart_GDX.jpg
GDX continues its dance with the 200D. The good news is its still trending up.
slopechart_GDX.jpg
Another gap for GDX. The bulls need this one to hold.
2
slopechart_GDX.jpg
GDX once again more than closes its gap. IMO, that is not bullish so I wait to enter long..
slopechart_GDX.jpg
GDX looks weak to my eye. The bounce off the gap is not bullish as it more than closed the gap. Price has not been...
4
VolatilityGrid_AAPL,FB,GOOGL,HD,INTC,MSFT,NVDA,T,V.jpg
slopechart_GDX.jpg
One gap closed, 2 remain below.
2
slopechart_TSLA.jpg
Fund rebalancing continues, S&P addition 12/21
slopechart_XOP.jpg
XOP possible head and shoulders formation.
1
slopechart_SPY.jpg
SPY Dragon

1
slopechart_DIA.jpg
Diamonds sit right on trendline
slopechart_TIP.jpg
Inflation protected U.S. Treasury bonds hit a new high
1
file
1
slopechart_SPY.jpg
SPY back in the channel.
1
slopechart_DIA.jpg
Diamonds on the edge
slopechart_DIA.jpg
The month of June so far for the Dow Industrials at 5 minute intervals. Today came close to an upside breakout.
slopechart_CHIQ.jpg
China consumer discretionary ETF at an all-time high.
1
slopechart_VGK.jpg
Vanguard Europe large-cap ETF (VGK) fills the gap and sits right at the broken trend line.
slopechart_IWM/SPY.jpg
Small Caps vs. Large Caps - Maybe this ratio will bottom just in time for the election.
1
slopechart_PSP.jpg
Private Equity ETF yields 10%
slopechart_IWO/IWN.jpg
Growth vs. Value ETFs. I see a slow grind higher for growth stocks relative to value stocks until the end of Octo...
3
slopechart_XLF/FR:DTWEXBGS.jpg
Here's an odd look at the financials ETF (XLF) plotted against the U.S. Trade-Weighted Dollar.
Install Bookmarklet — Slope of Hope
slopechart_GLD/FR:DTWEXBGS.jpg
A variation on paper gold vs. paper currency: This is gold, real or imagined held by GLD vs. the trade-weighted U...
slopechart_MDY.jpg
Mid Caps ETF is still a little shy of regaining the red trendline from 2009.
slopechart_CHIQ.jpg
Chinese consumer discretionary ETF. Thinly traded - 75K shares per day.
2
BOJ owns 80% of ETFs.jpg (1158×817)
slopechart_SPY.jpg
3
slopechart_XLF/SPY.jpg
Financials as a fraction of the S&P 500. Brutal stuff. Special thanks to Mr. Dubious.
3
slopechart_PHO.jpg
Water, water, everywhere...
slopechart_PBD.jpg
Clean Energy ETF.
https://www.invesco.com/us/financial-products/etfs/product-detail?productId=PBD
1
slopechart_GDX/XME.jpg
Mining and metals vs. Precious Metals.
slopechart_IWM.jpg
Russell 2K still squeezed in this triangle
slopechart_EWM.jpg
Malaysia ETF massive top.
https://www.ishares.com/us/products/239669/ishares-msci-malaysia-etf?cid=ppc:ishares_us...
slopechart_VTI.jpg
Big picture total stock market ETF: VTI
1
slopechart_VTI.jpg
Dead nuts on the red trendline for total market ETF: VTI
2
slopechart_EWN.jpg
Dutch Beatdown?
slopechart_EWJ.jpg
Japan ETF rejected at trendline
2
slopechart_EEM.jpg
$EEM close to filling the gap.

2
slopechart_XRT.jpg
XRT is looking overbought, may be time to start shorting retail stocks.
robin hood holders 4.27.jpg (1267×781)
slopechart_USO.jpg
The last 2 days in USO. Amethyst and Emerald
slopechart_USO.jpg
Today's action in USO in one minute increments: The slyphlike orange rectangle represents, in theory, the headlin...
slopechart_NOBL.jpg
Proshares Dividend Aristocrats ETF:
"There is no guarantee that dividends will be paid. Companies may reduce or...
slopechart_TLT.jpg
Headfake?
slopechart_FEZ.jpg
One doesn't think of the wearing of a Fez in the countries represented in this ETF: France, Germany, Netherlands,...
slopechart_FXI.jpg
China ETF - 50 large cap Chinese companies, but when I see "FX", I think of Forex: FXY, FXE, etc., not equities....
slopechart_SPY.jpg
March 9 - April 9: Did something happen while I was off in the woods?
3
slopechart_EWC.jpg
Great White North rejected at trendline
1