If you add a few more years as overlays, then normalize, you'll see some of the seasonality that leads to over-simplifications like "sell in May" etc.
You could then walk back and compare each year to its prior year (2011 compared to 2010, 1999 compared to 1998) and see the year-over-year correlation is not useful. Even if you optimize and fit, it's not what I'd call tradable, but there is a site that does make it child's play ... : ) 7/25/12
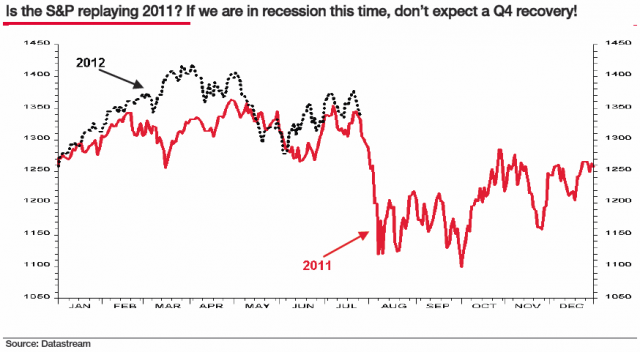
We need a catalyst for a drop - but at the moment it has not shown yet. Last August was the downgrading of US's credit rating to cause the markets to fall. 7/28/12
Hmmm. I had a reminder to myself to check in on how things were going with this. It certainly isn't holding up to its timeline. Not even close. 8/15/12
 Tim
Tim