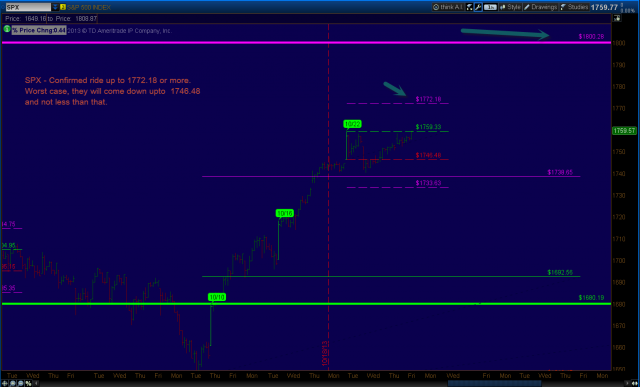
Going towards the signal's target price. Hopefully it will be there tomorrow. Also, regarding coloring....I have made my script to grey the price bars as we don't need to read the price bars rather looks for the bubbles and the lines that I draw. If you can't read the price on the lines, then please let me know. I tried in 2 different laptops and I was able to view them fine. Please comment. 10/29/13
The bubbles carry the month/day on which it occured and those are my signals. Green refers to Bullish or Extreme UP and White represents the RED or Bearish or Extreme Down or bottom 10/29/13


TK gonna send Slope bouncers after you...:) 10/27/13