Browse Stacks: Trading: Futures
slopechart_/ES.jpg
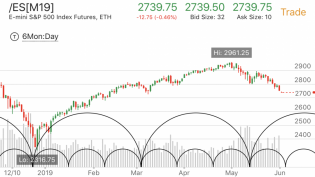
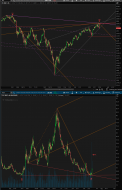
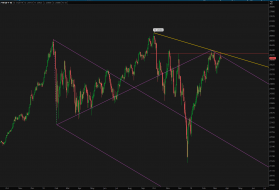
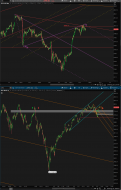
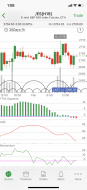
Follow on to my last effort.
Looks like the robot army doesn't give a hoot about statistical whatsits nor the y...

slopechart_/ES.jpg
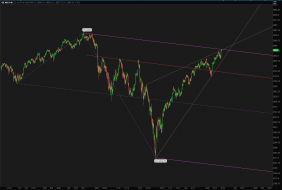
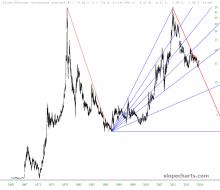
Purple whatsits is regression since the last crashtastic event.
Your A.I. overlords have decided to make a stan...
slopechart_$DJUSST.jpg
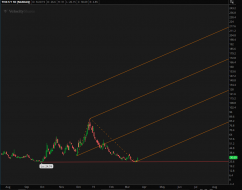
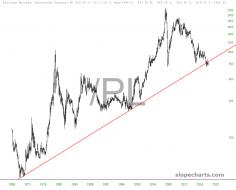
Iron & Steel Index at pre-GFC levels. Build Back Better?

net long.jpg (450×325)
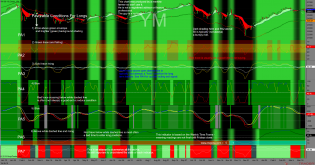
Equity futures positioning

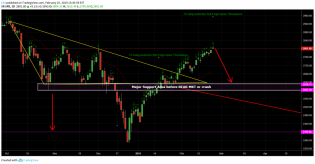
GBPEUR.jpg
$GBPEUR IH&S on the 1d chart. If you look at the 1h chart you'll see bull flags in quick succession. This is likel...

1
27000.jpeg (1200×1200)
1
s3.amazonaws.com/cdn2.soci..._Jl89de_l.jpg
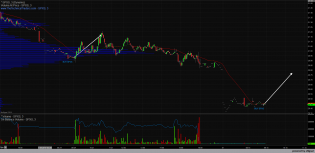
/BTC has declining wedge BULLISH, and break of Horiz. support BEARISH. I'm going with the declining wedge Bullish...

slopechart_/GC.jpg
Looks like the continuous gold futures contract /GC data ends 10/29/21, that's weird.

1
2021-10-12_CBOE_gammagraph_AMSPX.png (1200×500)
slopechart_/NG.jpg
Nutty Gas
1
natural gas
As NatGas breaks to a new low today it's either a massive opportunity or a complete disaster. Generational lows.

3
slopechart_GLD.jpg
GLD in a flag since early April. GC very similar.

2
slopechart_SPY.jpg
Fib and channel line match up. Measured move to 317.
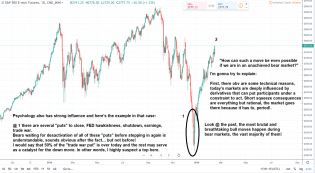
Hard to see anything anything bearish other than me bringing...
slopechart_/CME_RR.jpg
The price of rice.
1
slopechart_/NQ.jpg
The orange rectangle highlights a chart pattern known as a throwover.
2
slopechart_USO.jpg
The last 2 days in USO. Amethyst and Emerald
slopechart_USO.jpg
Today's action in USO in one minute increments: The slyphlike orange rectangle represents, in theory, the headlin...
slopechart_/ICE_SB.jpg
Sugar #11 Futures - The global benchmark for raw cane sugar. (No need to worry, Strawberry Blonde) This chart can...
4
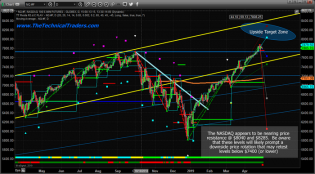
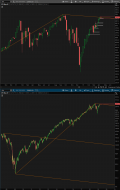
ES weekly.png
Weekly chart for /ES. Here's a chance for a professional trader to laugh at me. Notably with use of Ichimoku. But...
s3.amazonaws.com/cdn2.soci..._s9xisX_l.png
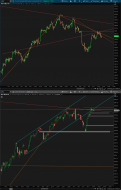
ES Daily descending triangle. Need a conviction close below or above.
2
slopechart_/CL.jpg
Hmm... /cl monthly chart with a trendline connecting the 2009 low to the 2016 low

tv.jpg
Scott Redler @RedDogT3
slopechart_/ES.jpg
ES weekly, linear scale

maund.jpg
From Clive Maund article.
3
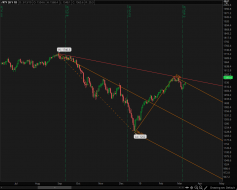
slopechart_/ES.jpg
/ES monthly, log
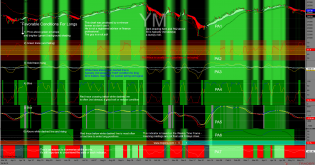
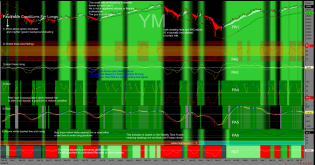
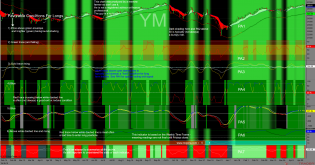
http://tradegato.com/gallery/albums/TradeGato/50_Shades_Of_Green_Wi...
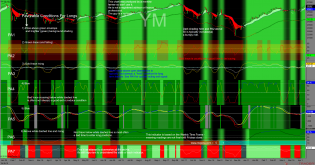
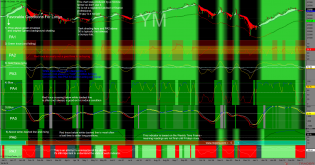
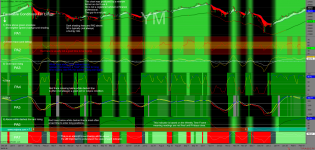
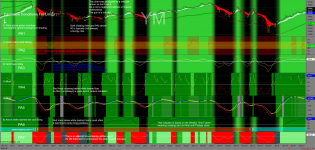
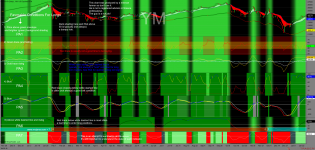
YM 01/17/2020

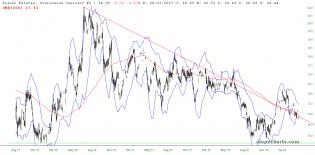
copper
Doctor Copper futures encountering resistance here and that would not be favored by global macro trades.
What Lies Beneath.jpg
A ton of poor structure lies beneath /ES' 12/27 close.

2019-12-29_9-44-42.jpg
(Intense)
Jan 17 v. Dec 19 Analog, notice also how ES is currently testing the Dec 18 rally trendline.
1
s3.amazonaws.com/cdn2.soci..._2JPzbW_l.png
2
s3.amazonaws.com/cdn2.soci..._NQ16lk_l.png
ES
1
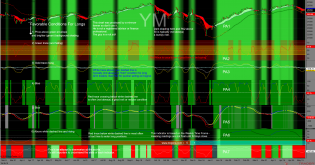
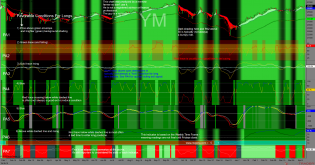
http://tradegato.com/gallery/albums/TradeGato/50_Shades_Of_Green_Wi...
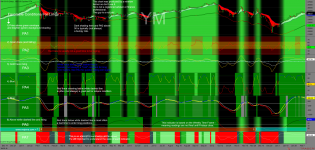
YM 12/23/2019
http://tradegato.com/gallery/albums/TradeGato/SP500-Future-ES-11-27...
ES 11/27/2019
2 nov19.PNG

1
1 nov19.PNG
3
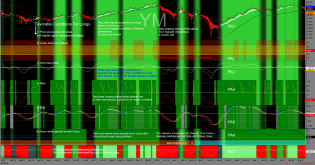
http://tradegato.com/gallery/albums/TradeGato/50_Shades_Of_Green_Wi...
YM 11/15/2019
http://tradegato.com/gallery/albums/TradeGato/FadeTheFraud-YM-11_08...
YM 11/08/2019
http://tradegato.com/gallery/albums/TradeGato/50_Shades_Of_Green_Wi...
YM 11/08/2019
s3.amazonaws.com/cdn2.soci..._EzYJPM_l.png
1
s3.amazonaws.com/cdn2.soci..._NPMRyD_l.png
1
http://tradegato.com/gallery/albums/TradeGato/50_Shades_Of_Green_Wi...
YM 10/18/2019 Special Notes in Yellow
http://tradegato.com/gallery/albums/TradeGato/50_Shades_Of_Green_Wi...
YM 10/04/2019
s3.amazonaws.com/cdn2.soci..._fuJzrD_l.png
RTY still in range after near perfect tag of support
s3.amazonaws.com/cdn2.soci..._lALLr3_l.png
NQ test of support
s3.amazonaws.com/cdn2.soci..._4VUyWu_l.png
1
s3.amazonaws.com/cdn2.soci..._1CPqul_l.png
RTY support and resistance levels
NUGT.png
http://www.321gold.com/editorials/sfs/hubbartt092019.html
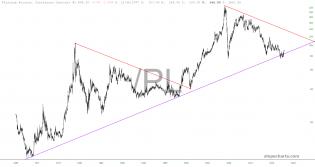
slopechart_/PL.jpg
Long-Term Platinum
2
slopechart_/ES.jpg
Fib ceiling on ES at the 2932
http://tradegato.com/gallery/albums/TradeGato/50_Shades_Of_Green_Wi...
YM 08/16/2019
1 Aug15.PNG
3
http://tradegato.com/gallery/albums/TradeGato/SAFT-ES-09-19-2019_08...
ES 08_03_2019
http://tradegato.com/gallery/albums/TradeGato/SAFT-ES-09-19-2019_07...
ES 07/19/2019
http://tradegato.com/gallery/albums/TradeGato/SAFT-ES-06-19-2019_06...
ES 06/21/2019
2
http://tradegato.com/gallery/albums/TradeGato/SAFT-ES-06-19-2019_06...
ES 06/07/2019
s3.amazonaws.com/cdn2.soci..._pgnPsP_l.png
Market looking extremely sick

http://tradegato.com/gallery/albums/TradeGato/50_Shades_Of_Green_Wi...
YM 06/01/2019
2
http://tradegato.com/gallery/albums/TradeGato/50_Shades_Of_Green_Wi...
YM 05/17/2019
http://tradegato.com/gallery/albums/TradeGato/50_Shades_Of_Green_Wi...
YM 05/10/2019
http://tradegato.com/gallery/albums/TradeGato/50_Shades_Of_Green_Wi...
YM 05/03/2019
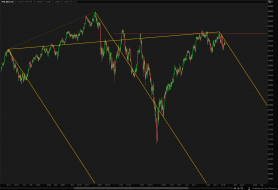
How Close Are The Markets From Topping? – Technical Traders Ltd.

slopechart_/PL.jpg
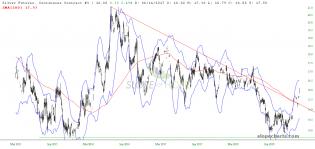
The purple line is an angle of +22 degrees, while the red lines are angles of -22 degrees. Imagine training a mac...
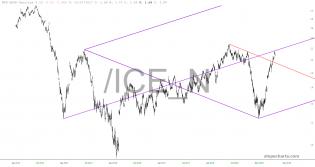
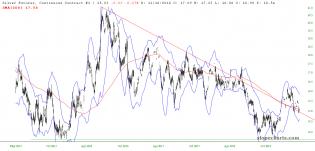
slopechart_/ICE_N.jpg
Gasoline might hit summer peak soon - or else...
http://tradegato.com/gallery/albums/TradeGato/50_Shades_Of_Green_Wi...
YM 04/26/2019
2019-04-21-1634 — imgbb.com

slopechart_/SI.jpg
/SI, death by a thousand cuts. The chart from 2011 is too brutally graphic to display in public.

slopechart_/GC.jpg
I expect a bounce here but see no sign it will rise above the long term zone of resistance. Just holding above the...

slopechart_/GC.jpg
Higher lows and lower highs, range compression which always leads to range expansion. Too bad it doesn't predict d...
http://tradegato.com/gallery/albums/TradeGato/50_Shades_Of_Green_Wi...
YM 04/12/2019
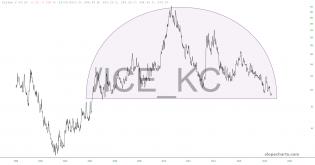
slopechart_/ICE_KC.jpg
Rise and Shine
http://tradegato.com/gallery/albums/TradeGato/50_Shades_Of_Green_Wi...
YM 04/05/2019
slopechart_/SI.jpg
Could be worse, let's see if /SI can stay above the falling 200D & descending trendline.
chart
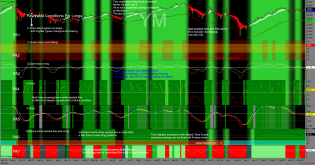
Today Gap Window Trader
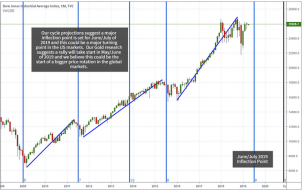
Proprietary Cycles Predict July Turning Point for Stock Market...
June/July Market Top
1
http://tradegato.com/gallery/albums/TradeGato/50_Shades_Of_Green_Wi...
YM 03/29/2019
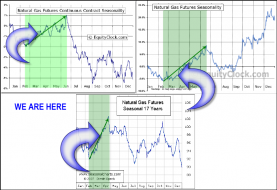
Natural Gas Sets Up Another Buy Opportunity – Technical Traders Ltd.
Natural Gas Bottoming Again
1
item5 — imgbb.com
2019-03-23-1341 — imgbb.com
1
http://tradegato.com/gallery/albums/TradeGato/50_Shades_Of_Green_Wi...
YM 03/22/2019
2019-03-22-0918 — imgbb.com
2019-03-21-2249 — imgbb.com
2019-03-19-1743 — imgbb.com
2
http://tradegato.com/gallery/albums/TradeGato/50_Shades_Of_Green_Wi...
YM 03/15/2019
2019-03-14-1853 — imgbb.com
item2 — imgbb.com
2019-03-12-1742 — imgbb.com

slopechart_/GC.jpg
I will be surprised if /GC doesn't tag the 200 day before making an all out assault on the upper band of resistanc...
1
http://tradegato.com/gallery/albums/TradeGato/50_Shades_Of_Green_Wi...
YM 03/08/2019
s3.amazonaws.com/cdn2.soci..._dTfikL_l.png
slopechart_/SI.jpg
Sludge
http://tradegato.com/gallery/albums/TradeGato/50_Shades_Of_Green_Wi...
YM 02/22/2019
slopechart_/PL.jpg
Platinum's turn in the sun?
7 feb17.PNG
6 feb17.PNG
http://tradegato.com/gallery/albums/TradeGato/50_Shades_Of_Green_Wi...
YM 02/15/2019
4 feb15.PNG
6
http://tradegato.com/gallery/albums/TradeGato/50_Shades_Of_Green_Wi...
YM 02/11/2019
s3.amazonaws.com/cdn2.soci..._eZ8rAv_l.png
Momentum weakening (declining adx), in TTM squeeze and overblught by RSI. Headed downward?
1
slopechart_/SI.jpg
SI breaks convincingly over the descending trendline. It needs to close above the June 2018 high to signal a trend...
http://tradegato.com/gallery/albums/TradeGato/50_Shades_Of_Green_Wi...
YM 01/25/2019