Browse Stacks: Business: Energy
slopechart_NOV,FANG,SLB.jpg
lockstep sisters

slopechart_/BZ//CL.jpg
Oily
slopechart_NEE.jpg
ready for breakout?
or exhaustion coming?
1
slopechart_RIG.jpg
perking up on Valaris acquisition
slopechart_XLE/SPY.jpg
1
slopechart_URA/SPY.jpg
gorgeous
slopechart_XLE/SPY.jpg
Energy dirt cheap
1
slopechart_URA/SPY.jpg
slopechart_CRAK.jpg
Got CRAK?
1
slopechart_OIH.jpg
trying to break out
slopechart_OIH.jpg
Slopecharts is working again
slopechart_UMI.jpg
9.8% yield
2
slopechart_COP.jpg
Chart by TK. Long Term. I drive an ICE. 10 years old 80K miles. Well maintained.

slopechart_ASPI.jpg
'nother strong momo
hailed by uranium experts as the most important stock for mankind, lol
1
slopechart_CCJ,URA,URNM,URNJ,UROY.jpg
two more
1
slopechart_ENFR.jpg
momentum trader?
rocket!
1
slopechart_LBRT.jpg
a bit of buying in the new year
slopechart_LBRT.jpg
TL tests holding
slopechart_FCG,DVN,WMB,KMI.jpg
Natty Space
slopechart_NXE.jpg
still looking strong
slopechart_FCG.jpg
looking positive
1
slopechart_AR.jpg
Appealing?
slopechart_LBRT.jpg
earnings puke, ouch
slopechart_RIG.jpg
getting pummeled in the current oil rout
slopechart_XLE.jpg
breakout in XLE
slopechart_LBRT.jpg
new ATH today
slopechart_SMR.jpg
volatile beast
retest, or something bigger?
slopechart_LBRT.jpg
still waiting for the breakout :-)
slopechart_TAN.jpg
unloved solar sector
very rate sensitive
1
slopechart_NXE.jpg
testing the channel - earnings tomorrow
slopechart_LBRT.jpg
testing the trend line
slopechart_RIG.jpg
approaching support
slopechart_SMR.jpg
strong today, next hurdle ~$6
slopechart_LBRT.jpg
poised to break out at last?
slopechart_RIG.jpg
Is it strong enough to reclaim the trendline?
slopechart_/CL.jpg
Oil still looking strong
slopechart_SMR.jpg
tough long
slopechart_SMR.jpg
Some like it volatile
slopechart_UNG.jpg
what a cluster...
1
slopechart_NXE.jpg
the round top that wasn't
2
slopechart_UNG.jpg
the cup floweth over
1
slopechart_USO.jpg
some upside, despite the bigger downtrend?
slopechart_UEC.jpg
rocket ship, waiting for a dip appears futile
1
slopechart_UEC.jpg
uranium
1
slopechart_CNP.jpg
Closed just below the broken trend line. Will it hold?
2023-07-21_08-51-32.jpg (807×584)
Biden draining the Strategic Petroleum Reserve like no one else ever has........

2
slopechart_CNP.jpg
Annoyingly strong
slopechart_UEC.jpg
Which way?
1
slopechart_RRC.jpg
Can it hold?
Time to stare at the long-term Uranium price | Notes From the Ra...
If you like a looooong-term base that has turned up then you like the Uranium price.

slopechart_XLE.jpg
pushing at the upper level
xop/xle ratio of energy sector internals
If you believe in this internal indicator (XOP/XLE ratio) and you're an Energy bull, 'ruh roh!' might be the appropri...
slopechart_/NG.jpg
Natty Heikin Ashi
2
natural gas futures price
NatGas is falling apart, seasonal negative and "the last inflated man standing" (Energy) is in trouble.
XLE, energy sector (oil and gas)
Energy sector froggies in a pot that will oh so slowly come to a boil (disclosure: short Energy).
2022-10-04_07-53-01.jpg (954×514)
Biden's political emptying of the SPR has left it with a record low of just 22 days supply...
1
‘Last inflated man standing’ needs a crutch – Notes From t...
"Last inflated man standing" may be joining the bear fest.
u7gpto6rbtj91.jpg (487×498)
2
unnamed-2_10.jpg (1002×536)
2022-07-20_12-34-00.jpg (986×606)
US pump prices have tumbled now for 34 straight days, President Biden's approval rating has just collapsed to a ne...
fredgraph.png (700×718)
Y/Y Change In CPI For Consumer Electricity, 2012-2022
1
energy-generation-capacity-share-north-america-by-source.jpg (10...
1
fredgraph.png (700×818)
Producer Price Index For Natural Gas To Consumers, 1990-2022
slopechart_SXC.jpg

Real-Oil-Price-Deviation-From-Trend-030422.png (542×360)
Oil-Inflation-Adjusted-Prices-and-Events-030822.png (926×518)
AVvXsEg2BkOwb70XcfN5KbHoLhZvFr_z_EJux3L8eFP0H_fVN3dhTiekzguE_Zzy8P7...
Oil is just about the only thing that we still make here.
slopechart_IMPP.jpg
Stack Genesis.
Sentiment: Bull
2
slopechart_HAL.jpg
Wedging
1
slopechart_TELL.jpg
Not super obedient to the channel, but the trend is there. Only way to really play this is very cheap OTM JAN lon...

slopechart_UNG.jpg
Approaching lower channel support
slopechart_$XOI.jpg
1
slopechart_USO.jpg
Still in the channel
slopechart_UNG.jpg
Natty still strong. Signs of a cold winter in many places
slopechart_KRBN.jpg
Crappy options, but has been on a tear while Euro companies needed carbon credits. With the confluence of Europe...
1
slopechart_PLUG.jpg
High volume bullish breakout
slopechart_URA.jpg
Radiant
2021-10-05_11-41-48.jpg (1280×638)
bfm511C_0.jpg (1015×572)
Natural gas goes ape-shit
2
bfm6DF8.jpg (1015×548)
2
slopechart_/NG.jpg
Nutty Gas
1
fredgraph.png (700×568)
West Texas Crude Price, Deflated By The CPI, 1971-1980
slopechart_LPI.jpg
This might be one that was just missed. (Unless you went long in Dec 20).

1
energy-1800-2020a.png (550×388)
energy-inefficiency11-20a.jpg (512×414)
3
1-bp-peak-oil.jpg (770×435)
2
EcP2nw-WkAA4fls.jpg (1200×849)
1
slopechart_RMO.jpg
H&S Behaving Nicely.
slopechart_RMO.jpg
RMO - Update: Nice H&S. Looks like the breakout has just taken place. (Comments welcome).
slopechart_RMO.jpg
Nice head and shoulders (comments welcome, i'm a bit new to charting).
slopechart_/CL.jpg
Crude Oil - WTI Crossing the Gap
The gap was officially closed on June 23 but the last two days (July 21 & 22)...

1
natural gas
As NatGas breaks to a new low today it's either a massive opportunity or a complete disaster. Generational lows.
3
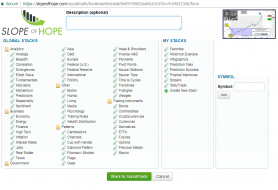
Install Bookmarklet — Slope of Hope

slopechart_XLU.jpg
9 of the top 11 holdings (50%) look pretty weak
2
slopechart_PBD.jpg
Clean Energy ETF.
https://www.invesco.com/us/financial-products/etfs/product-detail?productId=PBD
1
Contra Corner The Five Boroughs Of Covid-The Wrong Size That Fit...
91phf1unclv41.jpg (828×810)
1
slopechart_MDR.jpg
This one went to zero! Complete annihilation.

2
slopechart_BKR.jpg
And another
slopechart_HAL.jpg
Another
1