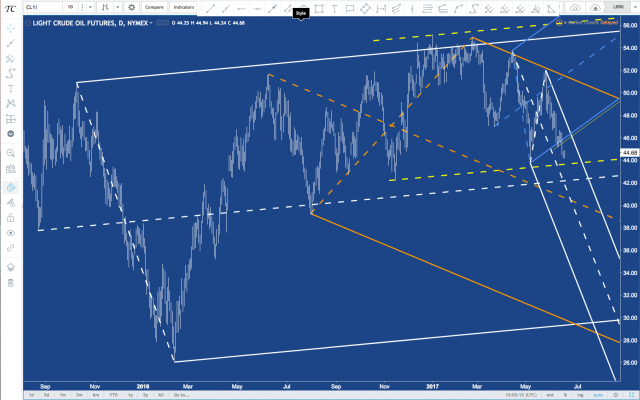
White Fork: Shows the way price is trading and where extremes are according to the current swing.
Orange Fork: The down sloper gives us the upper extreme and a potential target, which is down at the centerline (dashed orange)
Blue Fork: Gave me the pullback to the centerline and the indication, from where crude will turn south again.
White Fork: This is the path where price currently is trading to. If price leaves the white fork, then I have to work a little bit more at the following Idea.
Yellow dashed lines: Overshoot / Undershoot. They project a potential support/resistance from prior energy shifts.
Trade Idea: I wait until price is pulling back to the blue Fork's L-MLH (Lower-Medianline-Parallel). From there I will short crude down to a) the white centerline (partial), if it can manage to break the shift-line (yellow-dashed) and on a break of the white centerline and a pullback to it I short even more b) down to the orange centerline.
Info: - Forks are based on Newtons law of Action/Reaction. - Price has a tendency to go to the centerline over 80% of times. - Forks provide a very clear (mathematical) view, where price is really overextended, which is at any of the three lines. The upper and lower lines are always great points to wait for pullbacks and take the opposite side. 6/17/17


Shows the way price is trading and where extremes are according to the current swing.
Orange Fork:
The down sloper gives us the upper extreme and a potential target, which is down at the centerline (dashed orange)
Blue Fork:
Gave me the pullback to the centerline and the indication, from where crude will turn south again.
White Fork:
This is the path where price currently is trading to.
If price leaves the white fork, then I have to work a little bit more at the following Idea.
Yellow dashed lines:
Overshoot / Undershoot. They project a potential support/resistance from prior energy shifts.
Trade Idea:
I wait until price is pulling back to the blue Fork's L-MLH (Lower-Medianline-Parallel).
From there I will short crude down to
a) the white centerline (partial), if it can manage to break the shift-line (yellow-dashed)
and on a break of the white centerline and a pullback to it I short even more
b) down to the orange centerline.
Info:
- Forks are based on Newtons law of Action/Reaction.
- Price has a tendency to go to the centerline over 80% of times.
- Forks provide a very clear (mathematical) view, where price is really overextended, which is at any of the three lines. The upper and lower lines are always great points to wait for pullbacks and take the opposite side. 6/17/17