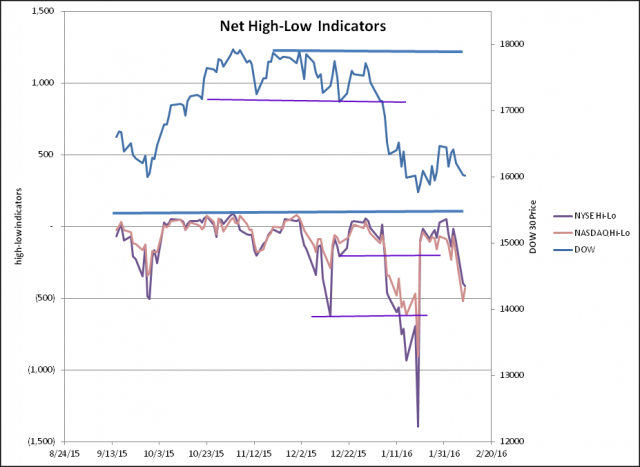
The cumulative has signaled a major trend change. It is currently indicating levels going back to 2013. The Net High-Low indicator is used to form the Cumulative HIgh-low and uses the difference of the stocks making 52 week highs minus the stocks making 52 week lows. bull divergence may help identify the next countertrend rally. Bear Divergence in the January low compared to the August low signaled that the bears were asserting control and the subsequent rally would be a fakeout. There is often a 1 or 2 day lead for short term bounces as smart money starts buying back into the market. 2/9/16
 Foxton

