Browse Stacks: Government: International
slopechart_/ES//DE30.jpg

slopechart_COP.jpg
Chart by TK. Long Term. I drive an ICE. 10 years old 80K miles. Well maintained.

slopechart_RTX.jpg
War is coming
2
slopechart_NOC.jpg
War is coming
slopechart_BA.jpg
War is coming
GBP_USD Mini_20250326_04.25.jpg
I am shorting Cable through GBP/USD mini because of the Chancellor of the Exchequer's Spring Statement on Wednesda...

1
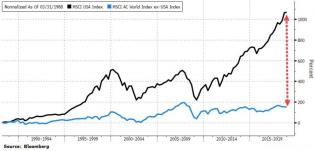
US stocks vs Europe.jpg (722×532)
The US has never been so overhyped, relative to the rest of the world, and which can be visualized in the followin...

0 (63)_4.jpg (910×661)
equity market cap by country.
illegal immigration.jpg (1153×890)
eod7.gif (736×395)
USA sovereign risk spikes
slopechart_FR:DEUPITGCG01GYQ.jpg
not sure what goods these are, the header is cut off, but it sure increased a tad of late...
slopechart_EWW.jpg
trend line gonna hold?
HP.jpg
Accurate reference work !
US vs Japan CPI.jpg (1261×644)
Japanese inflation is now higher than that in the US for the first time since October 2015.
tp18.png (800×600)
2
bfmA6F4_1.jpg (1039×644)
USA Sovereign risk has never been this high...
2023-04-22_14-02-54.jpg (565×432)
The U.S. dollar’s share of official global reserve currencies has gone from about 73 per cent in 2001 to around...
3
slopechart_MCHI.jpg
Low Mein for reopening
slopechart_FXI.jpg
Resistance turned into support
unnamed (4)_560.png (1280×759)
More trillions lost than in the GFC
FdscXfAWIBY2FrP (1092×817)
It's just all so beautiful..........
asset prices sept 2022.jpg (1193×621)
Down $29 Trillion Since November
current account US vs Russia.jpg (1273×619)
2022-06-26_06-41-30.jpg (999×563)
1
german inflation 3.30_0.png (1280×662)
German Retailers To Increase Food Prices By 20-50% On Monday
OC_GlobalHappiness_Main.jpg (1200×930)
Worldwide happiness.
1
Russia 5Y CDS.jpg (1163×689)
slopechart_EPAM.jpg
Long Epam.
1
caixing PMI.jpg (1267×633)
China PMIs Show Economy On Verge Of Contraction Amid Continued Growth Slowdown
ASD ASX.jpg
Australian Dollar ($XAD) divided by Australian Stocks ($AORD). Looking interesting.
bfm85E9.jpg (986×607)
European Covid-19
2
2021-08-30 (2).png (1158×675)
What a waste.
1
1956.jpeg
UK Car Production Posts Worst July Since 1956 courtesy of ZeroEdge.
9
DMP.jpg
Disposable Mask Pollution
2
4-4_3.png (1000×838)
debt-to-gdp-rise-around-the-world-1 (1).png (1280×847)
CCTV.jpg
The most surveilled cities in the world. Gulp!
1
2020-08-14_06-24-42.png (1280×645)
2
$26 trillion.jpg (984×548)
Central Bank Balance Sheets To Hit $28 Trillion Next Year
2
try.jpg
Weekly log chart of USD/TRY showing a cup and handle formation. Turkey's central bank has thrown most of its forei...
2
2020-07-21_1.png (800×497)
0 (2)_1.png (1280×605)
slopechart_$INDU.jpg
Punk ass rally on Industrials still falls short of the purple middle line of an Andrews Pitchfork that begins on 0...
US vs China Dalio_0.png (1174×600)
5
hmm.jpg
Bull flag on the monthly USDTRY currency chart. This one has moved slowly but it's just about got to where there i...
1
The Long Finger of Doom
Follow the money as it sails for any port in a storm.
slopechart_USO.jpg
The last 2 days in USO. Amethyst and Emerald
slopechart_$INDU.jpg
The highlighted candle is 3/6/2020 - 11 years to the day that marked the Financial Crisis bottom for the Dow. The...
1
slopechart_BA.jpg
I'm joining the Space Force.
Boeing’s expertise spans a broad range of products in defense. Fighter jets, rotorc...
2
Even The Fed Can't Save Markets Now | SafeHaven.com
graph.jpg
How many days are other countries behind Italy on the virus?
2
cv.jpg
Must have cost at least $60k for the software that generated this chart. I'm buying $YANG
EUreferendumResults.jpg
Daily Express published this chart on the UK's 2016 EU Referendum Results today which politicians have thus far fa...
1
slopechart_USD/CLP.jpg
USD/CLP (that's Chilean Peso, what's left of it).
1
10242019.png (816×497)
chartoftheday_19630_balanced_satisfaction_and_outlook_scores_for_th...
2
10-Year-Yield-Comparison.png (1280×853)
chartoftheday_14435_how_productive_is_an_hour_of_work_n.jpg (960×684)
inxg.jpg
TSI on UK index-linked gilts (the inflation play) looks a bit boring. Nice chart though.
2
Brexit.jpg
Yet another estimate.
jobs.jpg
If those are all the jobs affected by Brexit which I very much doubt. What are they waiting for?
3
H.M.S. Agamemnon laying cable.jpg
The H.M.S Agamemnon laying Cable. One of two ships involved in laying the transatlantic Cable. That Cable is the r...
Cable.png
Cable since January 2016 appears to be forming a large 'W'. Likely to continue bottoming at least till 31 October 2019.
img-12-1.png (706×670)
2
bfmCA5B_0.jpg (976×505)
1
purchasers.png (330×423)

1894.JPG
1894 global imports and exports
w7vBXIwUjbQiEvX7-hI8Z0dpmIAh2Ta2VNLdqTt80KU.png (1302×847)

slopechart_BCS.jpg
$BCS Barclays looks like it's setting itself up for some upside action.
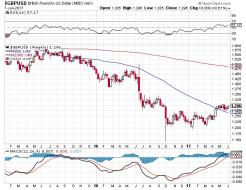
GBPUSD.jpg
Nailed the last IH&S.
2

GBPUSD.jpg
IH&S on Cable ($GBPUSD)
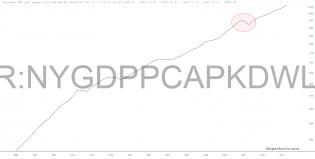
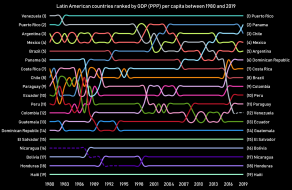
slopechart_FR:NYGDPPCAPKDWLD.jpg
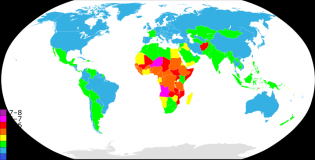
Fertility_rate_world_map_2.png (856×435)
Reproduction rates (basically Central Africans are reproducing like it's going out of style)
3
Nikkei2256M.PNG
Nikkei 6 month chart.

2
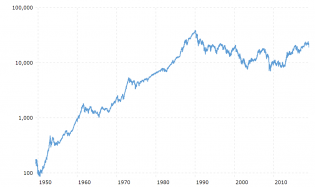
Nikkei225all.PNG
Nikkei historical chart.
1

journos.jpg
Where the most journalists are imprisoned worldwide

ECB v Fed.jpg
ECB v Fed

homeownership.jpg
Home ownership in Europe.
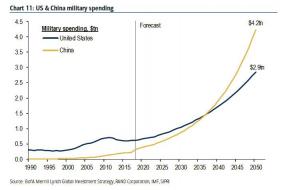
bofa superpower.jpg (723×475)
1
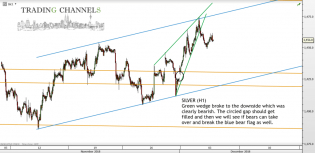
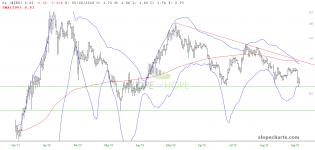
Chart of the day – Trading Channels
Thanks @Silver!
@TK you and MJ are market genius's. "You are not Alone"! Thanks @Gonnabesick, SOH Best Music Vid...

1
The Long Finger of Doom
Global stocks (ex. U.S.) Financials and consumer goods are almost half of the index. Tech only 10%, Energy only 7%
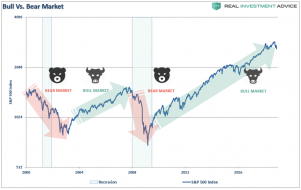
SP500-Bull-Bear-Market-112618-2.png (890×561)
2018-11-12_17-21-55.png (890×464)
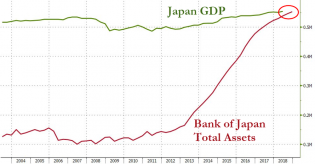
Bank Of Japan Total Assets Surpass Japan's GDP
5
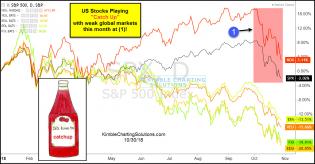
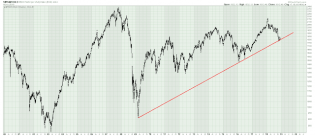
us-stocks-playing-catch-up-with-global-markets-oct-30.jpg (1234×645)
1
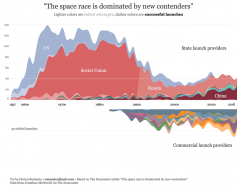
75hvzuiwnpt11.png (960×768)
The space race

wwg.png
The widening wage gap. This isn't just happening in America. This is happening throughout the developed world. Def...
2
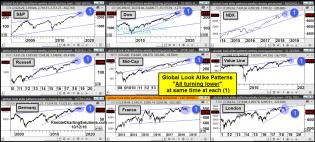
global-look-alike-9-pack-oct-12.jpg (1561×707)
rgjnvh5cirs11.jpg (960×848)
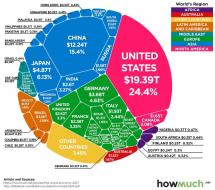
Global GDP
2018-10-04_10-19-44.jpg (890×428)
Finally we note that the divergence between the US and the rest of the world is now at a 30 year high...
slopechart_$ZRX.jpg
https://www.youtube.com/watch?v=x-lLjyyaMbg

1
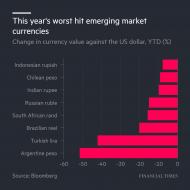
worsthitemergingmarketcurrencies.jpg
This year's worst hit emerging market currencies.
1
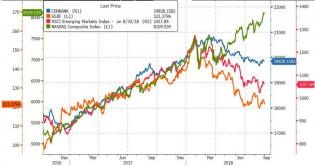
Nasdaq Surges To Best August Since 2000, Bonds Bid As EM Collaps...
Spot The Odd One Out!! US Tech stocks (green), Global Central Bank Balance Sheet (blue), Emerging Market Stocks (r...

DlHHM5CU4AAm0Q_.jpg (540×348)
When's the party over?

1
Imgur: The magic of the Internet
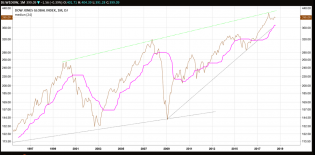
DJ Global Index with 2 year median. Globally market valuations have not recovered to previous highs. Global equi...
Imgur: The magic of the Internet
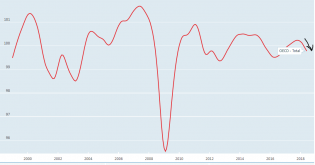
The OECD composite leading indicator (CLI) is designed to provide early signals of turning points in business cyc...
Imgur: The magic of the Internet
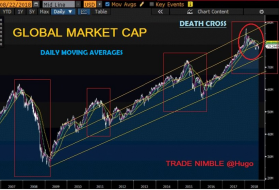
Death X marks the trend in global market cap
1 aug24.png
Thanks @SILVER
@POTUShithole has really lost the plot. He and his DEPLORABLES are finally being shown the Jail....
7
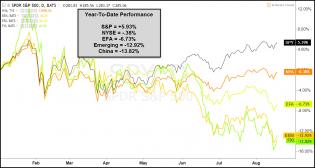
performance-year-to-date-world-lagging-aug-21.jpg (1235×660)
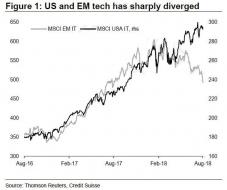
tech stocks US vs EM.jpg (599×501)
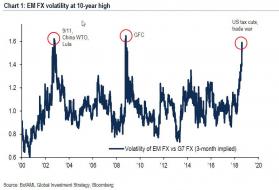
EM vs DM FX vol.jpg (873×594)