User: Nf6: Long Term Trend
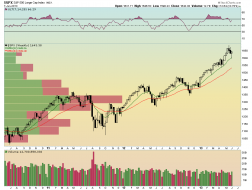
$SPX
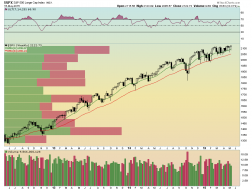
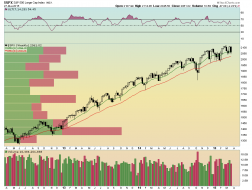
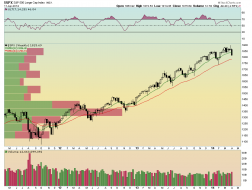
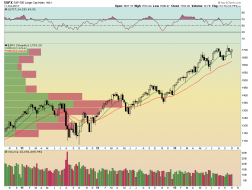
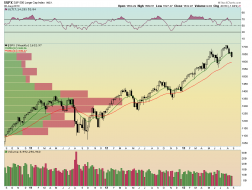
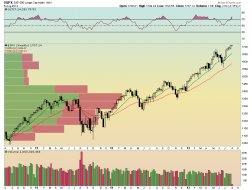
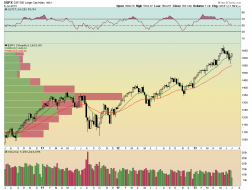
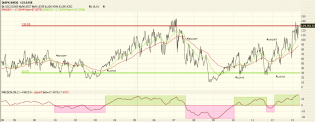
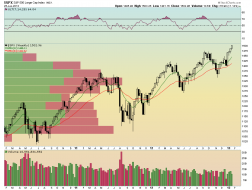
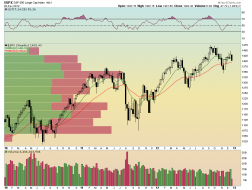
SPX weekly is flirting with the 34 EMA

1
$SPX
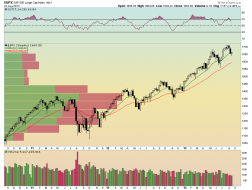
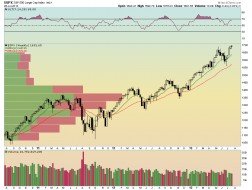
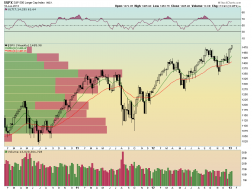
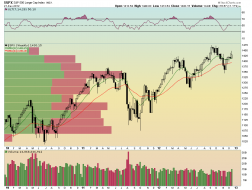
Look! Below the 34 week EMA. For how long?
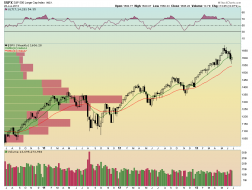
$SPX
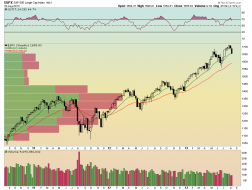
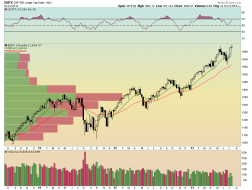
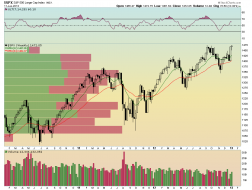
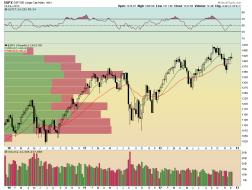
Nothing to see here folks, move along
$SPX
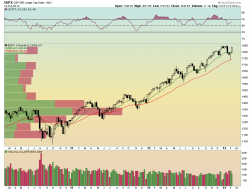
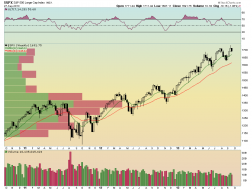
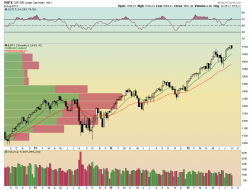
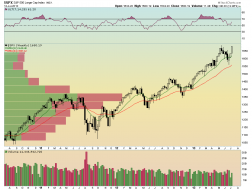
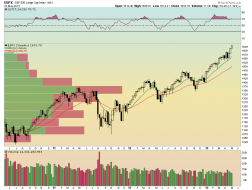
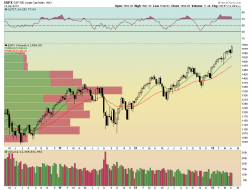
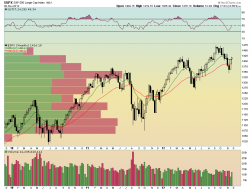
$SPX weekly - a succession of higher lows.
1
$SPX
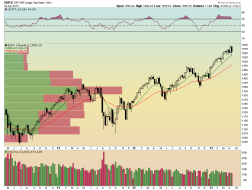
Weekly $SPX - persistent bull, hammers on the last two candles = more buying?
$SPX
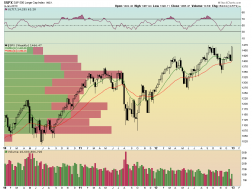
Relentless
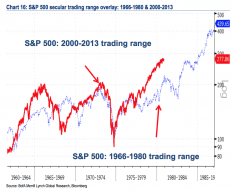
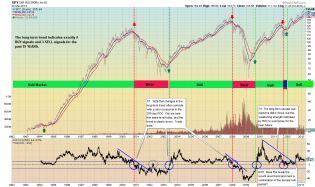
4
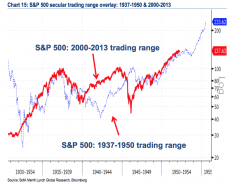
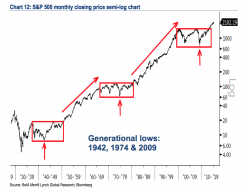
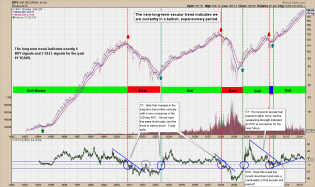
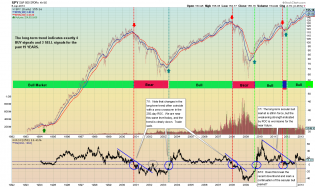
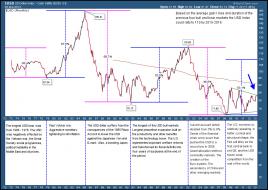
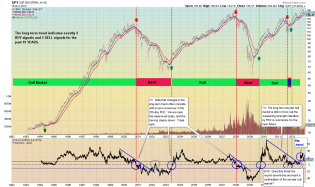
From http://www.ritholtz.com/blog/2015/04/generational-lows-lined-up-overlay-also-suggests-risk-of-cyclical-top-in-2015/
1
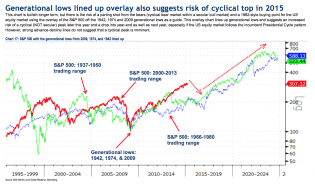
3
From http://www.ritholtz.com/blog/2015/04/generational-lows-lined-up-overlay-also-suggests-risk-of-cyclical-top-in-2015/
2
From http://www.ritholtz.com/blog/2015/04/generational-lows-lined-up-overlay-also-suggests-risk-of-cyclical-top-in-2015/
1
From http://www.ritholtz.com/blog/2015/04/generational-lows-lined-up-overlay-also-suggests-risk-of-cyclical-top-in-2015/
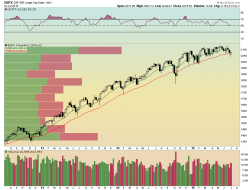
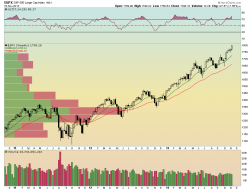
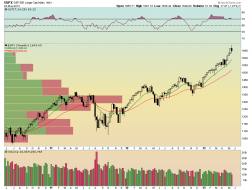
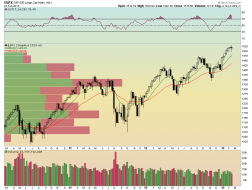
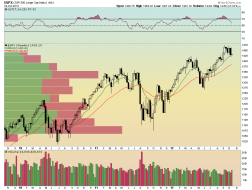
$SPX
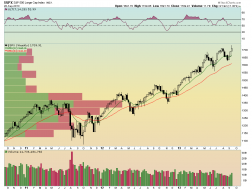
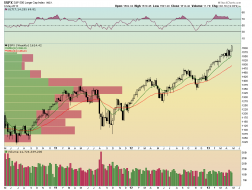
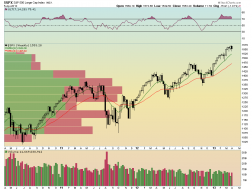
SPX weekly = bullish trend intact, but note the lower weekly highs and higher weekly lows of late
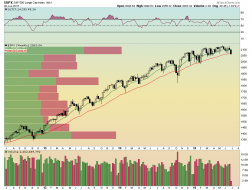
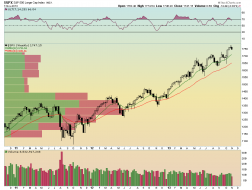
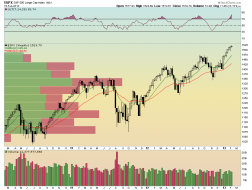
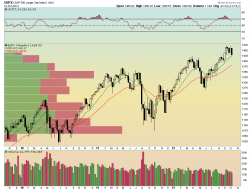
$SPX
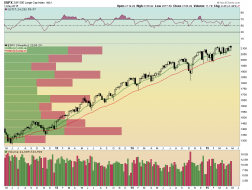
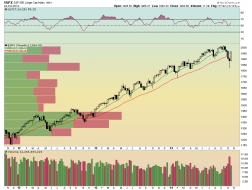
SPX weekly - long term trend is bullish
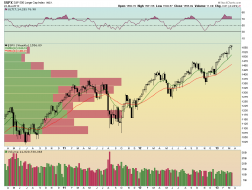
4
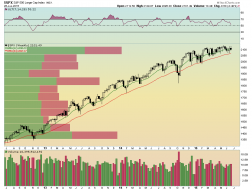
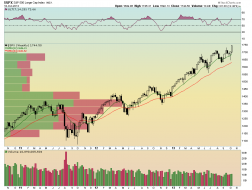
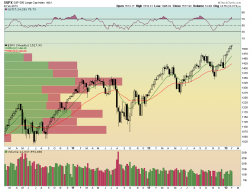
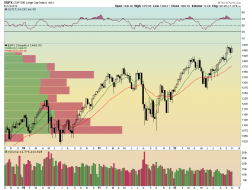
$SPX
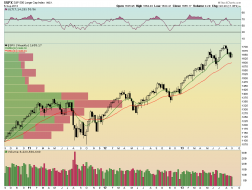
SPX weekly with 13 and 34 EMAs - still long term bullish. This isn't very sensitive to short term swings, see for...
1
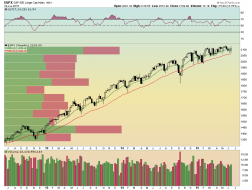
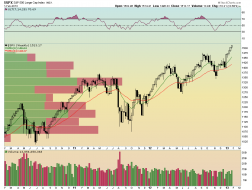
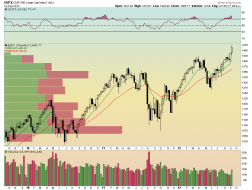
$SPX
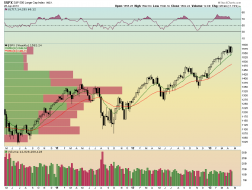
SPX weekly - and the bull is back
$SPX
2nd week below both EMAs - just look at that weekly candle! Bounce coming?
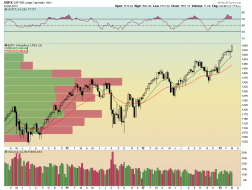
3
$SPX
SPPX weekly with 13 and 34 EMAs. Starting to get beary beary scary.
2
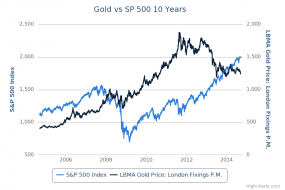
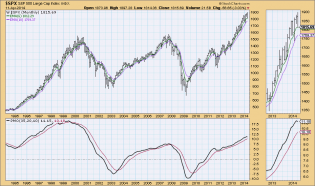
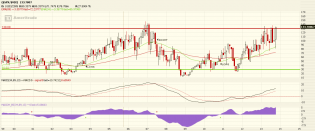
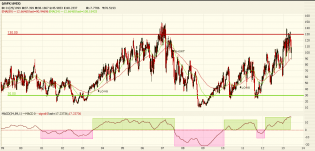
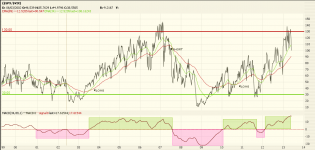
Gold vs SP 500 10 Years
As requested
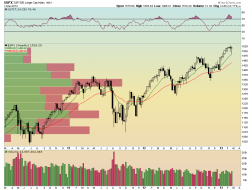
4
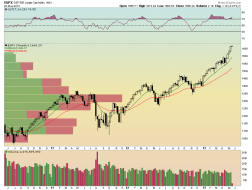
$SPX
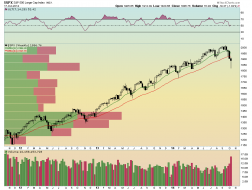
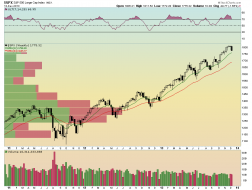
Weekly SPX - the bull is unrelenting.
1
$SPX
SPX weekly - long term bullish - unchanged

$SPX
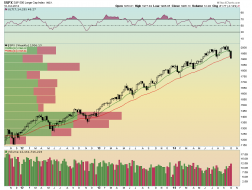
SPX weekly - still bullish since we aren't close to a MA crossover. We had a little "doji" week and it remains to...
2
$SPX
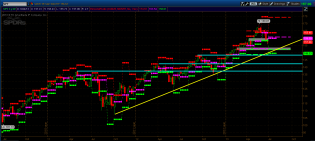
Long term trend remains intact (up, of course).
http://content.screencast.com/users/Jim_Nf6/folders/Jing/media/17af...
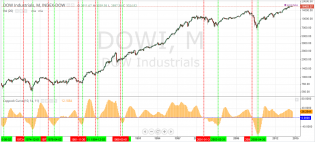
Dow Industrials, monthly with Coppock Curve
$SPX
$SPX weekly with 13 and 34 EMAs (7/18/14)
Nothing bearish here
1
Intermarket Analysis & Business Cycle Investing - David Calloway...
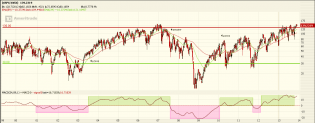
SPY Daily, ROC(250) is breaking the trend but is not negative.
from David Calloway
3

Intermarket Analysis & Business Cycle Investing - David Calloway...
avid Calloway chart.
Break in trend on the ROC(250) -early warning, it's not negative yet and the 100 EMA is no...
2
DecisionPoint Market Analysis Chart Gallery - StockCharts.com -...
From Carl Swenlin at Decision Point
3
$SPX
SPX weekly
Gotta get down to the 34 week EMA
3
$SPX
SPX weekly with 13 and 34 EMAs (2/14/14)
Bounce of the 34 EMA
$SPX
SPX weekly with 13 and 34 EMAs (12/13/13)
A nice black candle that breaks below the last two dojis. Is this an...
3

$SPX
SPX weekly with 13 and 34 EMAs (12/6/2013)
A couple of dojis but no change in trend.
http://content.screencast.com/users/Jim_Nf6/folders/Jing/media/018e...
SPX/VIX ratio chart

$SPX
SPX weekly with 13 and 34 EMAs (11/27/13)
Up, up and away!
1
$SPX
SPX weekly with 13 and 34 EMAs (11/15/13)
This chart echoes Tim's post. Since May of 2012 we have not had more...
1
$SPX
SPX weekly with 13 and 34 EMAs (11/7/13)
We have a long way to go for the long term trend to begin turning dow...
1
http://content.screencast.com/users/Jim_Nf6/folders/Jing/media/2bcc...
SPX/VIX Ratio, monthly with MACD
I wish we had more data for these long 3-4 year cycles. Next sell signal in 20...
1
$SPX
SPX weekly with 13 and 34 EMAs (10/18/13)
$SPX
SPX weekly with 13 and 34 EMAs (10/11/13)
The long term trend remains bullish.

$SPX
Still very much bullish
$SPX
SPX weekly with 13 and 34 EMAs (9/27/13)
One down week in the bull market - guess we have to somewhere.
$SPX
SPX weekly with 13 and 34 EMAs (9/20/13)
And the trifecta is on - all three time frames are bullish.
$SPX
SPX weekly with 13 and 34 EMAs (9/6/13)
The long term trend is bullish and will remain so until the 13 EMA cros...
3
$SPX
SPX weekly with 13 and 34 EMAs (8/30/13)
The long term trend remains bullish and I remain a broken record.
$SPX
SPX weekly with 13 and 34 EMAs (8/23/13)
It's been hard to string a series of down weeks together as we bounce...
$SPX
SPX weekly with 13 and 34 EMAs (8/16/13)
Last week's big black candle has taken us to the 13 week EMA. We will...
$SPX
SPX weekly with 13 and 34 EMAs (8/9/13)
The long term bullish trend remains intact.
2
$SPX
SPX weekly with 13 and 34 EMAs (8/5/13)
$SPX
SPX weekly with 13 and 34 EMAs (7/26/13)
Despite a slightly down week, the long term trend is bullish.
$SPX
SPX weekly with 13 and 34 EMAs (7/18/13)
And the long term trend is still .... wait for it ... bullish.
$SPX
SPX weekly with 13 and 34 EMAs (7/12/13)
The long term trend remains bullish and has made a new closing high.
2
$SPX
SPX weekly with 13 and 34 EMAs (7/5/13)
Bullish - what else?
1
$SPX
SPX weekly with 13 and 34 EMAs (6/28/13)
The long term trend is still bullish, but price is below the 13 EMA an...
http://content.screencast.com/users/Jim_Nf6/folders/Jing/media/ec07...
SPY weekly with monthly and quarterly Person's Pivots (6/25/13)
A liitl longer view with multiple downside targ...
1

$SPX
SPX weekly with 13 and 34 EMAs (6/21/13)
The long term trend is still bullish, but the weekly has finally pierc...
1

$SPX
SPX weekly with 13 and 34 EMAs (6/14/13)
The long term trend is still bullish.
http://content.screencast.com/users/Jim_Nf6/folders/Jing/media/6b75...
SPX/VIX ratio chart weekly with 34 and 89 EMAs (6/7/13)
Still bullish.
$SPX
SPX weekly with 13 and 34 EMAs (6/7/13)
The long term trend remains bullish and a suspiciously hammer like wee...
2013-06-01_0951 - Jim_Nf6's library
$SPX/$VIX Ratio weekly with 34 and 89 EMAs

$SPX
SPX weekly with 10 and 34 EMAs (5/31/13)
The long term trend remains bullish. There is a lot of air between the...
$SPX
SPX weekly with 13 and 34 EMAs (5/24/13)
We just closed the first down week in a month. We haven't yet had a lo...
1
$SPX
SPX weekly with 13 and 34 EMAs (5/20/13)
2013-05-11_1611 - Jim_Nf6's library
SPX/VIX Ratio Chart weekly (5/10/13) with 56 and 89 EMAs
Just noodling with long and short signals
$SPX
SPX weekly with 13 and 34 EMAs (5/10/13)
Yes, Virginia, it is still bullish
$SPX
SPX weekly with 13 and 34 EMAs (5/3/13)
An unrelenting bull
$SPX
$SPX weekly with 13 and 34 EMAs (4/2/13)
Still bullish long term
$SPX
SPX weekly with 13 and 34 EMAs (4/19/13)
No change in the bullish uptrend
$SPX
SPX weekly with 13 and 34 EMAs (4/12/13)
Broken record bullish.
1
$SPX
SPX weekly with 13 and 34 EMAs (4/5/13) The long term trend remains bullish
Intermarket Analysis & Business Cycle Investing - David Calloway...
SPX daily, 100 and 200 SMA and ROC (250) (4/5/13) long tern trend
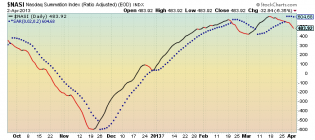
$NASI
$NASI PSAR is bearish
2
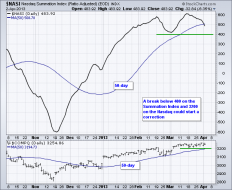
$NASI
1
The Slippery Slope Investment and Chuckle Forum
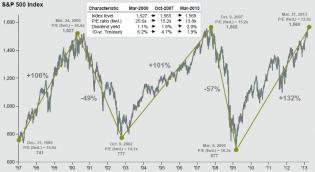
SP.jpg 958×524 pixels
From "The Big Picture"
1
Intermarket Analysis & Business Cycle Investing - David Calloway...
$SPX
SPX weekly with 13 and 34 EMAs (3/22/13) The long term trend remains bullish, understating the obvious. Does this...
$SPX
SPX weekly with 13 and 34 EMAs (3/8/13) Bullish.
$SPX
SPX weekly with 13 and 34 EMAs (3/1/13) The EMAs and price are still in a bull trend, but three dojis in a row loo...
$SPX
SPX weekly with 13 and 34 EMAs (2/22/13) The long term trend remains bullish
$SPX
SPX weekly with 13 and 34 EMAs (2/15/13) Bullsih, seven white candles n a row - is this market getting tired yet?
$SPX
SPX weekly with 13 and 34 EMAs (2.8.13)
$SPX
SPX weekly with 13 and 34 EMAs (2/1/13) bullish
$SPX
SPX weekly with 13 and 34 EMAs (1/25/13) bullish
$SPX
SPX weekly with 13 and 34 EMAs (1/18/13) Bullish
$SPX
SPX weekly with 13 and 34 EMAs (1/11/13) bullish long term trend remains intact.
$SPX
SPX weekly with 13 and 34 EMAs (1/4/12) The long term trend remains bullish
$SPX
SPX weekly with 13 and 34 EMAs (12/28/12)
The long term trend is still bullish
$SPX
SPX weekly with 13 and 34 EMAs (12/21/12) still bulish
$SPX
SPX weekly with 13 and 34 EMAs (12/14/12) Still bullish.

$SPX
SPX weekly with 13 and 34 EMAs (12/7/12) Weekly doji and still bullish
$SPX
SPX weekly with 13 and 34 EMAs (11/30/12) bull trend continues

$SPX
SPX weekly with 13 and 34 EMAs (11/23/12) Still long term bullish.
Business Cycle Investing - David Calloway - Public ChartList - S...
From David Calloway's Business Cycle Investing - SPY long term trend, 250 day ROC approaching a crossover. http://sto...
$SPX
SPX weekly with 13 and 34 EMAs (11/17/12) Price has remained below both moving averages
$SPX
SPX weekly with 13 and 34 EMAs (11/9/12) price has closed below both EMAs
$SPX
SPX weekly with 13 and 34 EMAs (11/2/12) Bullish - still
$SPX
SPX weekly with 12 and 34 EMAs (10/19/12)
$SPX
SPX weekly with 13 and 34 EMAs (10/12/12) still bullish
$SPX
SPX weekly with 13 and 34 EMA (10/512) Bullish

$SPX
SPX weekly with 13 and 34 EMA (10/3/12) bullish

$SPX
SPX weekly with 13 and 34 EMAs (9/21/12) Bullish
$SPX
SPX weekly with 13 and 34 EMAs (9/14/12) bullish