User: Nf6: Long Term Trend: $SPX
$SPX
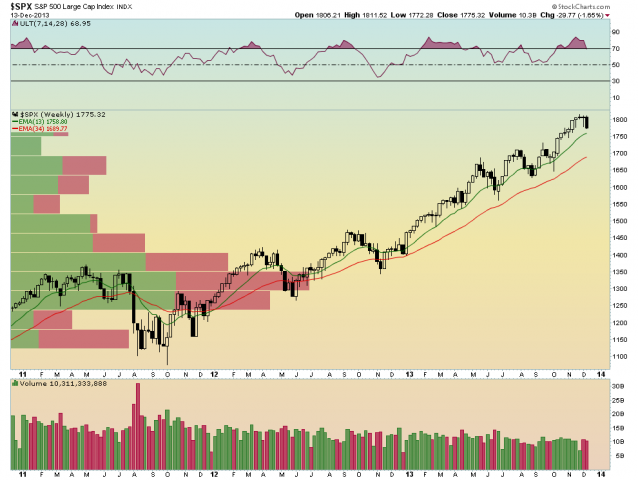
SPX weekly with 13 and 34 EMAs (12/13/13)
A nice black candle that breaks below the last two dojis. Is this an early sell signal? Long term the chart is bullish, any kindergarten kid can show you the chart rises from left to right. Corrections and bear markets have to start somewhere. If not here, then why not?
 Market Sniper


