Browse Symbol Stacks: EEM
slopechart_EEM.jpg
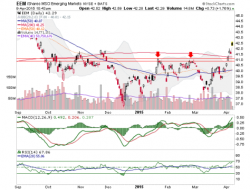
Anybody short $EEM?

1
slopechart_EEM.jpg
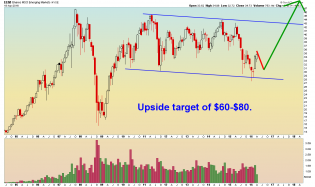
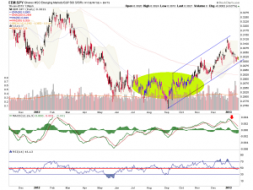
$EEM channeling up?
slopechart_EEM.jpg
EEM at top of channel
slopechart_EEM.jpg
Reposting from a few minutes ago. For some reason it posted to the old post.
The last four tops look mighty si...
1
slopechart_EEM.jpg
@Tim Knight I was looking at EEM during lunch. One of the articles I read last night suggested EEM might do well...
slopechart_EEM.jpg
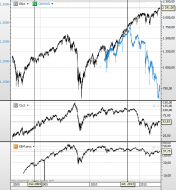
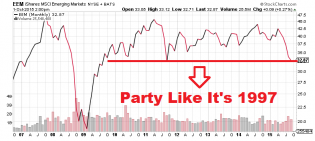
Liquidity waning

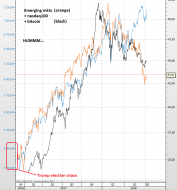
Emerging markets ETF (EEM) and US dollar (UUP, USD)
If you ever want to short USD, just buy EEM. Inverse EM is USD.

slopechart_EEM.jpg
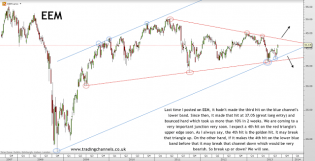
EEM - The short term lines that matter.

1
slopechart_EEM.jpg
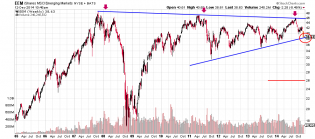
Sitting on channel support.

slopechart_EEM.jpg
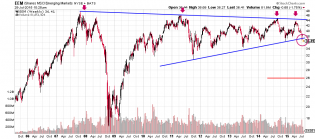
yet another bearish trendline broken to the upside
next up red channel top and red horizontal resistance
slopechart_EEM.jpg
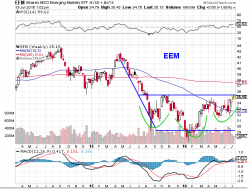
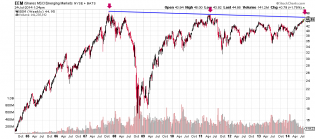
$EEM close to filling the gap.

2
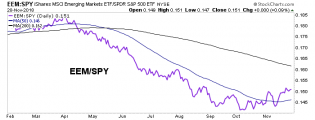
slopechart_EEM,EEM/SPY.jpg
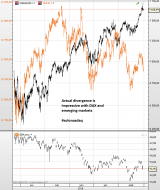
EEM, EEM/SPY 5 year divergence
1
slopechart_EEM.jpg
Thanks @LZ Another one to watch for a puke! $EEM
Mueller now moves to the other committee.
Here you go! Read...

1
eem-about-to-break-support-and-submerge-may-22.jpg (1886×913)

slopechart_EEM.jpg
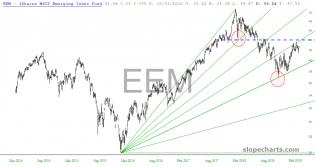
Fibonacci fan lines on EEM. First major retrace support at exactly the 23.6 line. Reversal exactly forms current t...
1
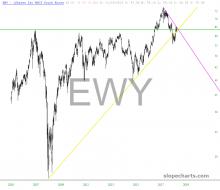
slopechart_EWY.jpg
Thanks @Gerald - It's POTUS 'leadership'! LOL :-)
WIZDOM - Sam Zell '20
https://www.cnbc.com/video/2019/03/06/u...

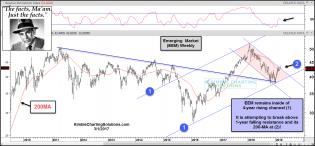
joe-friday-eem-attempting-dual-breakout-mar-1-3.jpg (1567×730)
Who Was Lying? – Notes From the Rabbit Hole
EMs among other global markets liked the jawbone.
Who Was Lying? – Notes From the Rabbit Hole
So it was USD off sides after all.
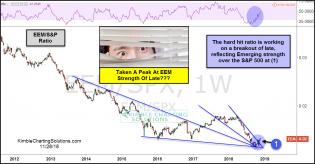
eem-spy-ratio-breaking-above-bullish-falling-wedge-nov-28.jpg (1...
3
Who’s Lying, Uncle Buck or Those Counter to It? – Notes From...
Who's lying, Uncle Buck or those counter to it? Deflation? Really?
1
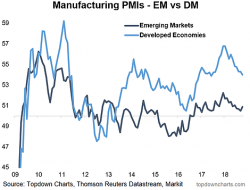
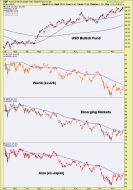
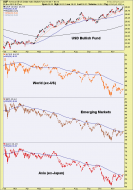
EM vs. DM Manufacturing PMIs – No robo-content, no ads and no bullshit
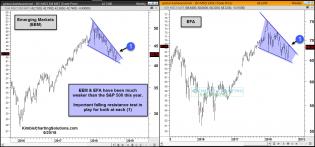
eem-and-efa-facting-key-resistance-tests-sept-25.jpg (1565×732)
2 aug31.png

1 july6.PNG
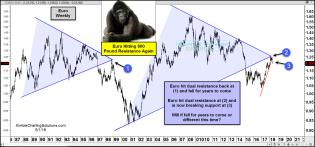
euro-800-pound-resistance-test-may-2.jpg (1567×734)
slopechart_EEM.jpg
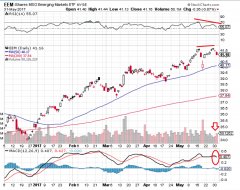
China is key to emerging market ETFs such as EEM.

slopechart_EEM_31618.jpg
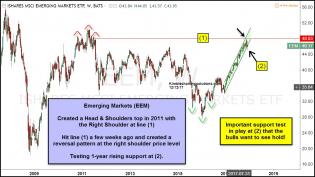
emerging-markets-testing-rising-support-dec-12.jpg (1191×673)
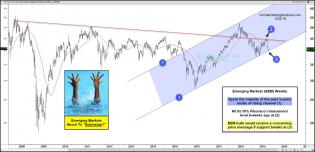
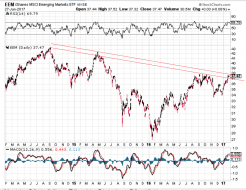
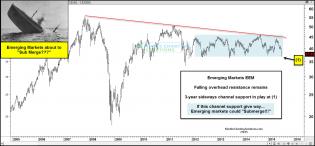
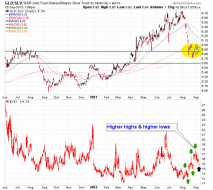
Emerging markets bull trend could fail here!eem
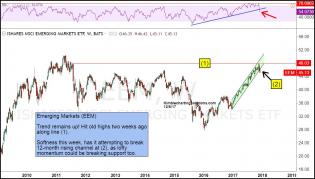
eem-breaking-support-of-12-month-rising-channel-dec-6.jpg (1186×676)
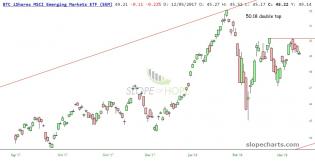
Emerging Markets about to “Sub-Merge?”
1
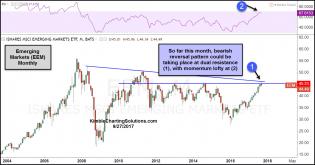
eem-monthly-reversal-at-dual-resistance-sept-27.jpg (1293×678)
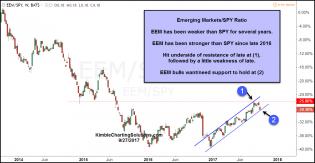
eem-spy-ratio-testing-support-after-hitting-resistance-sept-27.j...
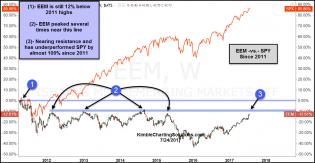
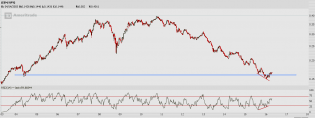
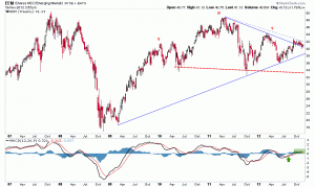
eem-vs-spy-since-2011-highs-july-24.jpg (1297×673)
Below compares the performance of EEM to the S&P 500 since 2011
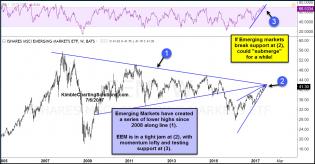
emerging-markets-testing-cluster-of-resistance-july-6.jpg (1296×676)
Emerging Markets (EEM) has done well this year, gaining over twice as much as the S&P 500 (17% -vs- 7%). These gai...
2
5 may31.PNG
Interesting
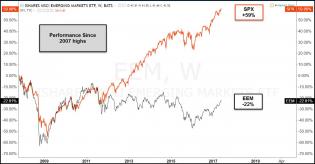
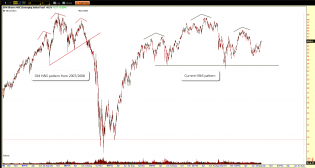
comparison-eem-spy-since-2007-highs-may-30.jpg (1295×675)
Emerging Markets; Testing 2007 breakout level again!
2
1 may26.PNG
Top candidate on EEM
7 feb4.PNG
You can see that the global economy is much much weaker than during the last tightening cycle.
No surprise there,...
4 jan29.PNG
Interesting!
And this one has such a big divergence with ES since 2011
20160713EEM.png
bear flag vs. bull inverse H&S. Who will win?

EEM-SPY.PNG
EEM regaining support relative to SPY

EEM - 4.18.16.png
EEM monthly. This is not investment advice.

2
20151001eem.png
Yuan-ted a reason why this is going down, baht you wouldn't listen.
eem.png
EEM Update: Support breaking. Look out below.

1
EEM_Weekly_july272015.jpg
EEM testing multi-year support level it had not traded since late June of 2013

eemabouttosubmergerjuly9.jpg (1569×732)
Emerging markets hovering above the abyss
1
EEM_Weekly_May102015.jpg
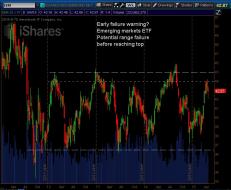
Could emerging markets be rolling early?
The weekly chart of EEM suggests that possibility after failing to clo...
1
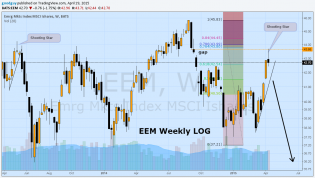
EEM Weekly log.png
EEM Weekly LOG: Last week I suggested that EEM may be about to fall but wait for sign of reversal. Friday's down a...

3
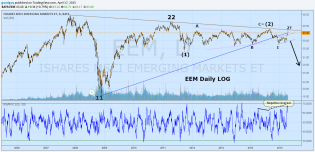
download.png
EEM Emerging markets Daily LOG: Short term the emerging markets are on a tear up. But from a longer perspective th...
eem
Emerging Market ETF breaks daily chart resistance.
eem.png
EEM: Symmetrical Trendiness. Support about to be broken.
eem.png
EEM: Emerging markets. One heck of a resistance level here. What's next?
12

content.screencast.com/use...ison42514.jpg
1 Year Comparison: EEM/RUT/EWJ
A few things of note that have changed so far in 2014. First, since mid-March em...

1
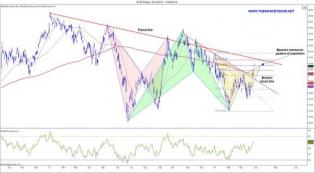
The Market Zone | Weekly Markets Analysis - 30/3/14
Multiple harmonic trading patterns in $EEM. Find more trading ideas in the Weekly Markets Analysis PDF file

eem.spy
EEM trying for 2nd day above MA 200. EEM vs. SPY up hard. This despite stronger USD and few inflation concerns.
eem
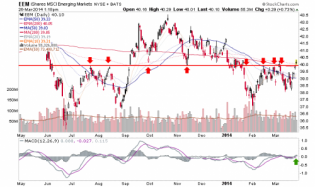
Emerging market ETF is breaking above well defined lateral resistance.
3
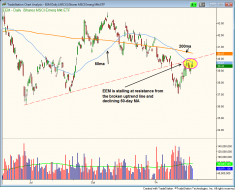
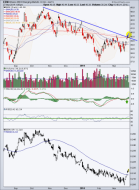
$EEM STALLING AT THE 50-DAY ma
How To Profit From Submerging Emerging Markets ETFs: http://blog.morpheustrading.com/3759

eem
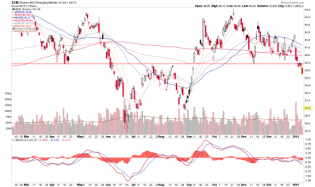
EM's going lower. I remain short from the neckline. Measured target noted on chart.
2
eem
Emerging Market ETF EEM losing a clear support level.
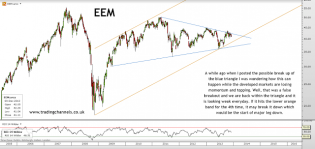
Trading channels: Russell2k breaking the trap
Non-emerging markets

Trading channels: Consolidating charts
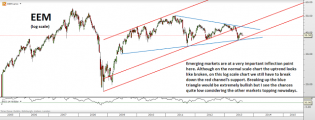
Emerging markets failed to re-emerge.
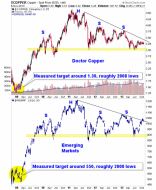
cu.msemf
Doctor Copper prescribes a bearish treatment for emerging markets.
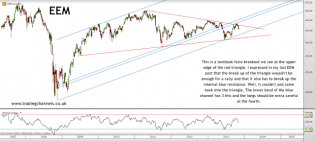
Trading channels: End of the week charts
Emerging markets reemerging?
gsr.vix
Market made me capitulate and book loss on SPY puts yesterday. Today these bearish indicators beneath the surface...
Trading channels: Declining channel forming
Emerging markets will make it or break it.
5
content.screencast.com/use.../EEM32713.gif
EEM 5 year Daily Chart
Check out the great short setup on EEM. Trendline break off the 2009 lows, and wedge b...
eem.spy
Emerging markets a buy vs. broad US market
eem
So is the Emerging Market ETF in a H&S or a Symmetrical Triangle... one very bearish, the other maybe the opposite.
1
eemdangersouskissaug30.gif (1577×730)
content.screencast.com/use.../EEM83112.gif
EEM Chart. The end is nigh....
eemefaperfectstormaug14.jpg (1561×693)
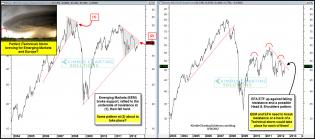
Europe topping out
Forming a Major Top

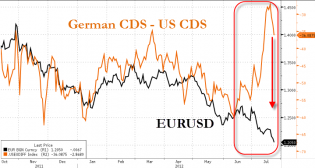
20120724_EURUSD_vs_CDS.png (719×384)
The spread between Germany and USA 'risk' has risen notably since the EU Summit. This implicitly means the market...
1
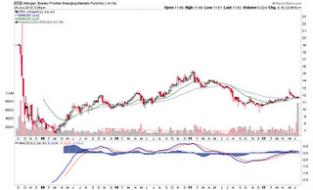
Biiwii TA and Commentary: Frontier Emerging Markets fund FFD
Frontier Markets (the riskiest of the risky emerging markets spectrum) are in a tight bull flag... one of many NEG...
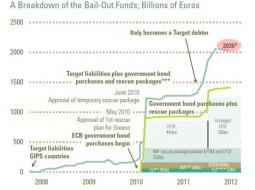
Europe's Bailout Costs In One Chart: €2 Trillion And Counting...
European bailout costs
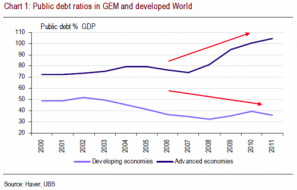
The Good, Bad, And Ugly Of Emerging Markets | ZeroHedge
A Tale of Two Continents - Graphic - NYTimes.com
Nicely shows how different Europe and the U.S. are right now with respect to their economies
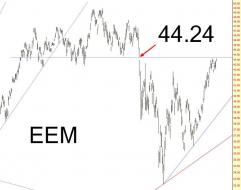
0217-EEM
Nice example of a gap fill with the ETF symbol EEM