Browse Symbol Stacks: EEM: EEM Weekly log.png

EEM Weekly log.png

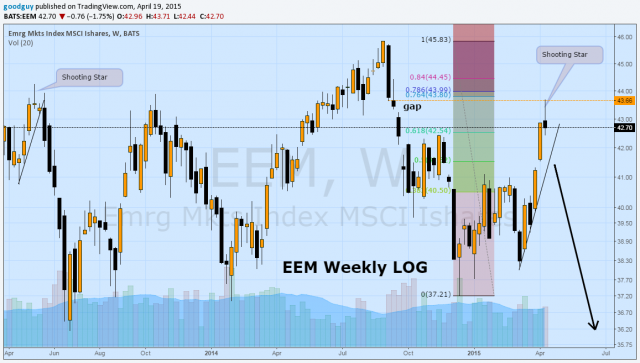
EEM Weekly LOG: Last week I suggested that EEM may be about to fall but wait for sign of reversal. Friday's down action wiped out all the gains in EEM for the week producing a nice shooting star weekly candle. After a large rise this is often a sign of reversal. Some authors suggest that one way to trade this is to short with a stop on any close > than the high (in this case > 43.71.) Others might wait for the up trend line to be broken. Notice the price this week went just high enough to take out a weekly gap (those nasty gaps) but did not reach .78 retraction. So possibly there could be one more intra day shot at that level. ETFs: 2x bear EEV,, 3x bear EDZ.  
Disclaimer: This is not a recommendation to trade but hopefully will be helpful in the way you choose to trade.  
Take care. Have a good upcoming week. Tom B

Comments

urban outdoorsmanurban outdoorsman
Nice chart. Thanks 4/19/15
DinkDink
I really like this chart; good work. I only respectfully disagree with the conclusion though. The most recent shooting star candle only saw a very modest increase in volume from the prior day and looks to be about average over several days. This tells me that not much supply was present in that shooting star and therefore there is no shorting opportunity yet. Gaps are often areas of profit taking so seeing a shooting star at that price is not surprising, however the question is will there be follow through on the downside and I don't think there will be. Especially given the impressive strength seen in the prior two weeks: look at those two prior weekly candles. Wide ranges, both closing at the highs and through a neckline resistance area near $41 which is now strong support. As I read it, there is ease of movement to the upside and to expect limited downside and an eventual break higher targeting $45 and higher. 4/19/15
TombTomb
Dink. Thanks for the feedback and insights. Hope you have a good week 4/19/15
...