Browse Symbol Stacks: IWM: IWM Daily LOG.png
IWM Daily LOG.png
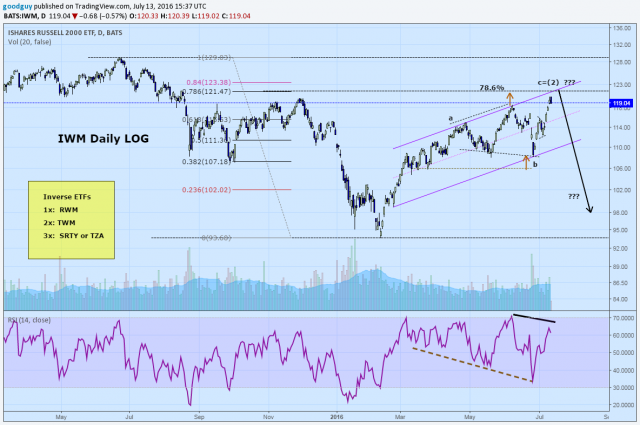
Here is my current view of the small caps. The weekly chart (not shown) has developed a negative reversal in the RSI . There is now a bearish divergence in the daily RSI (solid black line). A projected target (short up arrows) from the recent positive reversal in the daily RSI is at the level of a 78.6% correction (around 121-122). This also is at the upper channel line. Also at this level c=.62 a. So would be a great spot for a reversal. Will be watching the daily and weekly candles for a "sign" this is correct analysis. Have a great week. Tomb
 Dink
Dink
...