Browse Symbol Stacks: IWM: slopechart_IWM.jpg
slopechart_IWM.jpg
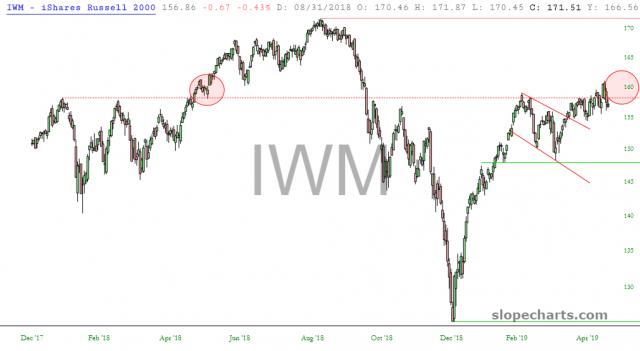
I would be looking for a similar price pattern in the right circle as the one that appeared in the left circle as a long signal. Of course, the breakout up from the bull flag (red trendlines) is a pretty clear bullish signal. The measured move is around 188.50 to the upside. Very low risk with a 154.50 stop
Comments
 MississippiMan